English
  Русский
 Bahasa Indonesia
 Bahasa Malay
 ไทย
ไทย Español
 Deutsch
 Български
 Français
 Tiếng Việt
 中文
中文 বাংলা
বাংলা हिन्दी
 Čeština
 Українська
 Română

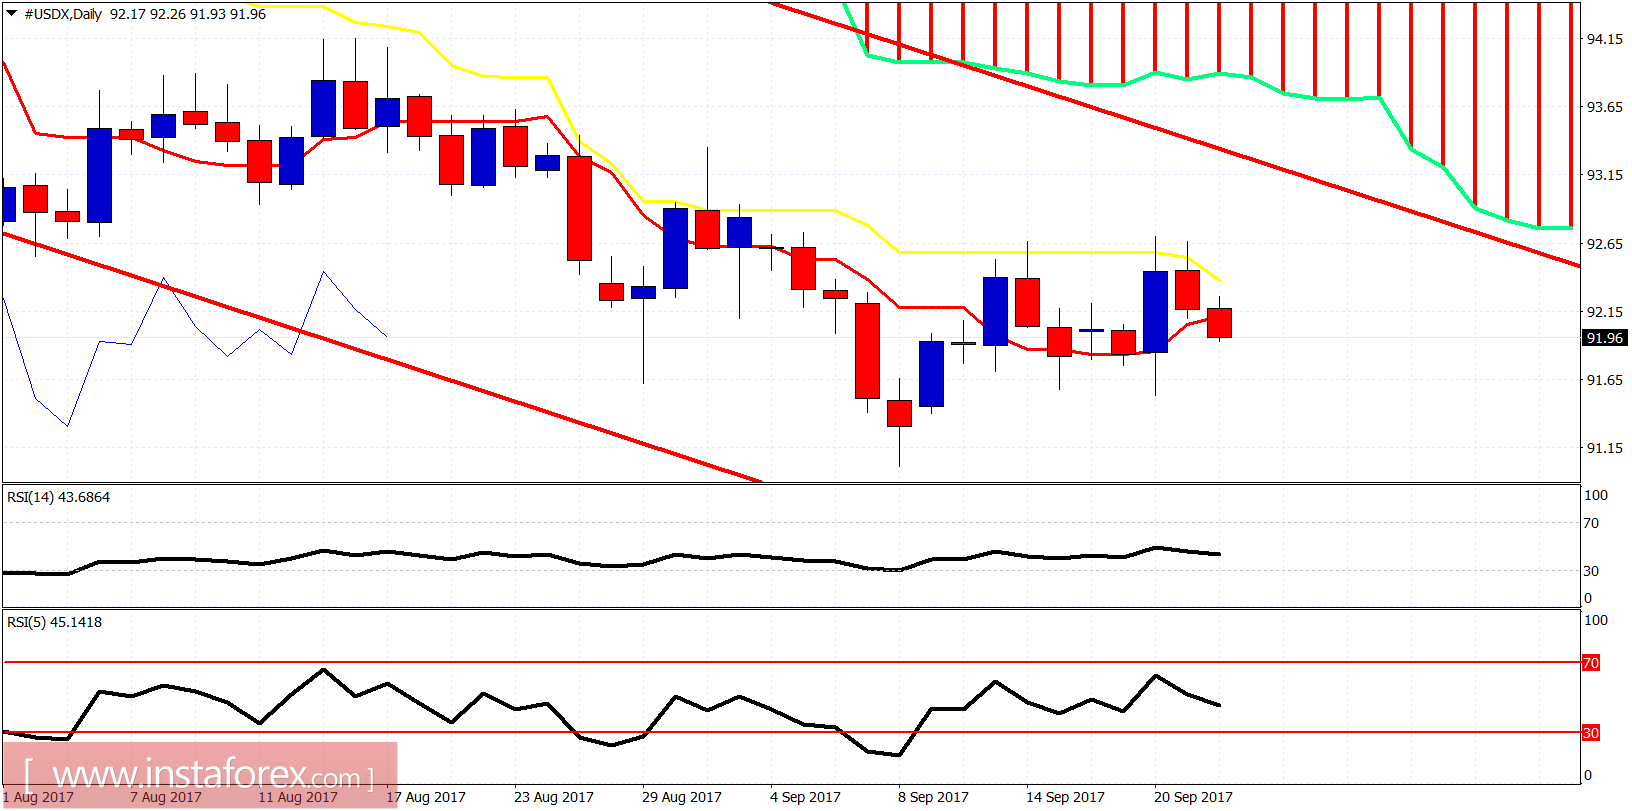
The Dollar index despite making a new short-term high near 92.50, is pulling back as expected by our previous post towards the 92 cloud support. Is this a fake breakout like the last time or a back test that will provide a new bounce?
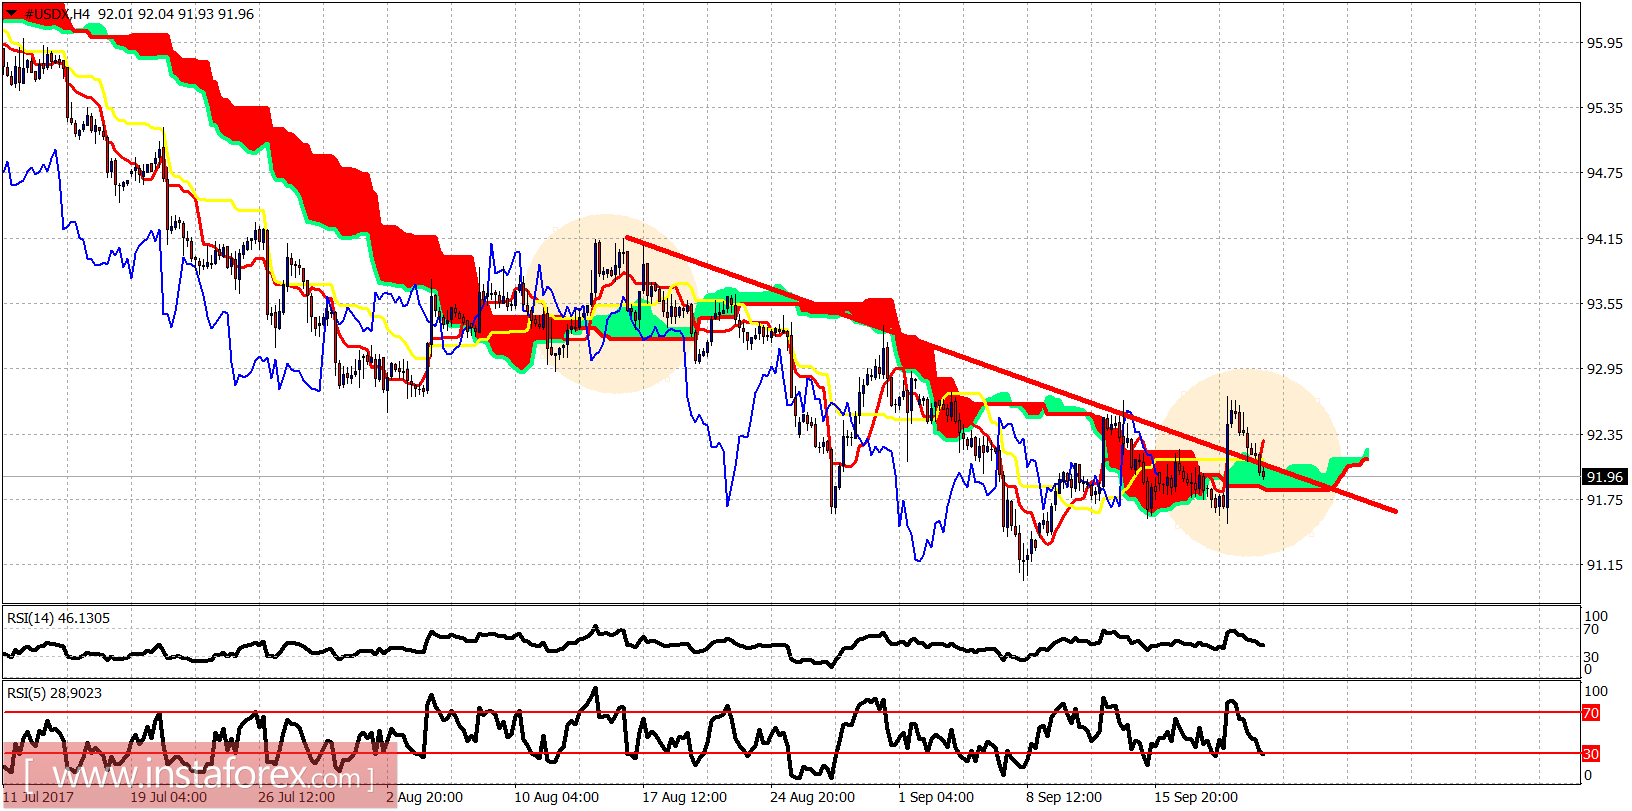
The Dollar index has broken above the red trend line and is now back testing it. Price has also broken above the 4-hour Kumo (cloud) and is back testing it again. The last time price broke above the 4-hour Kumo we witnessed a false break out and a reversal. Will the bearish trend resume? There are high chances of this happening specially if price breaks below support at 91.60.