 English
  Русский
 Bahasa Indonesia
 Bahasa Malay
 ไทย
ไทย Español
 Deutsch
 Български
 Français
 Tiếng Việt
 中文
中文 বাংলা
বাংলা हिन्दी
 Čeština
 Українська
 Română

Gold price is showing reversal signs off the $1,290 area and the bottom of the bearish channel. As we were expecting Gold provided a new low below $1,300 and is now rising. Gold price could have already made an important low.
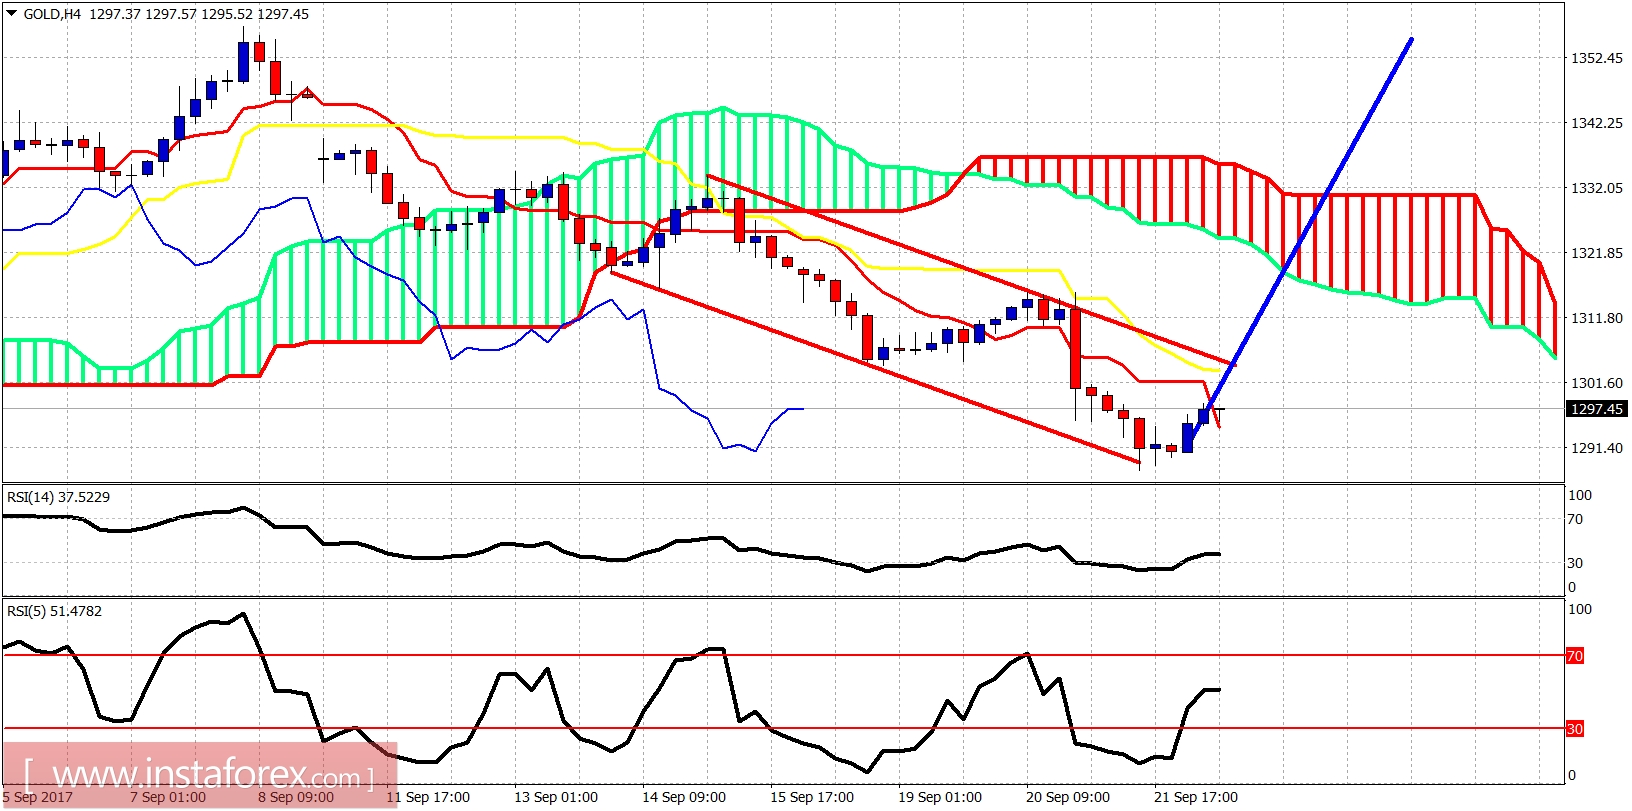
Blue line - expectation
Gold price is bouncing. Price however remains inside the bearish channel and below the kijun-sen and the Kumo (cloud). Resistance is at $1,303 and at $1,317. Breaking above $1,317 will increase dramatically the chances for a full scale reversal and a move towards $1,400.
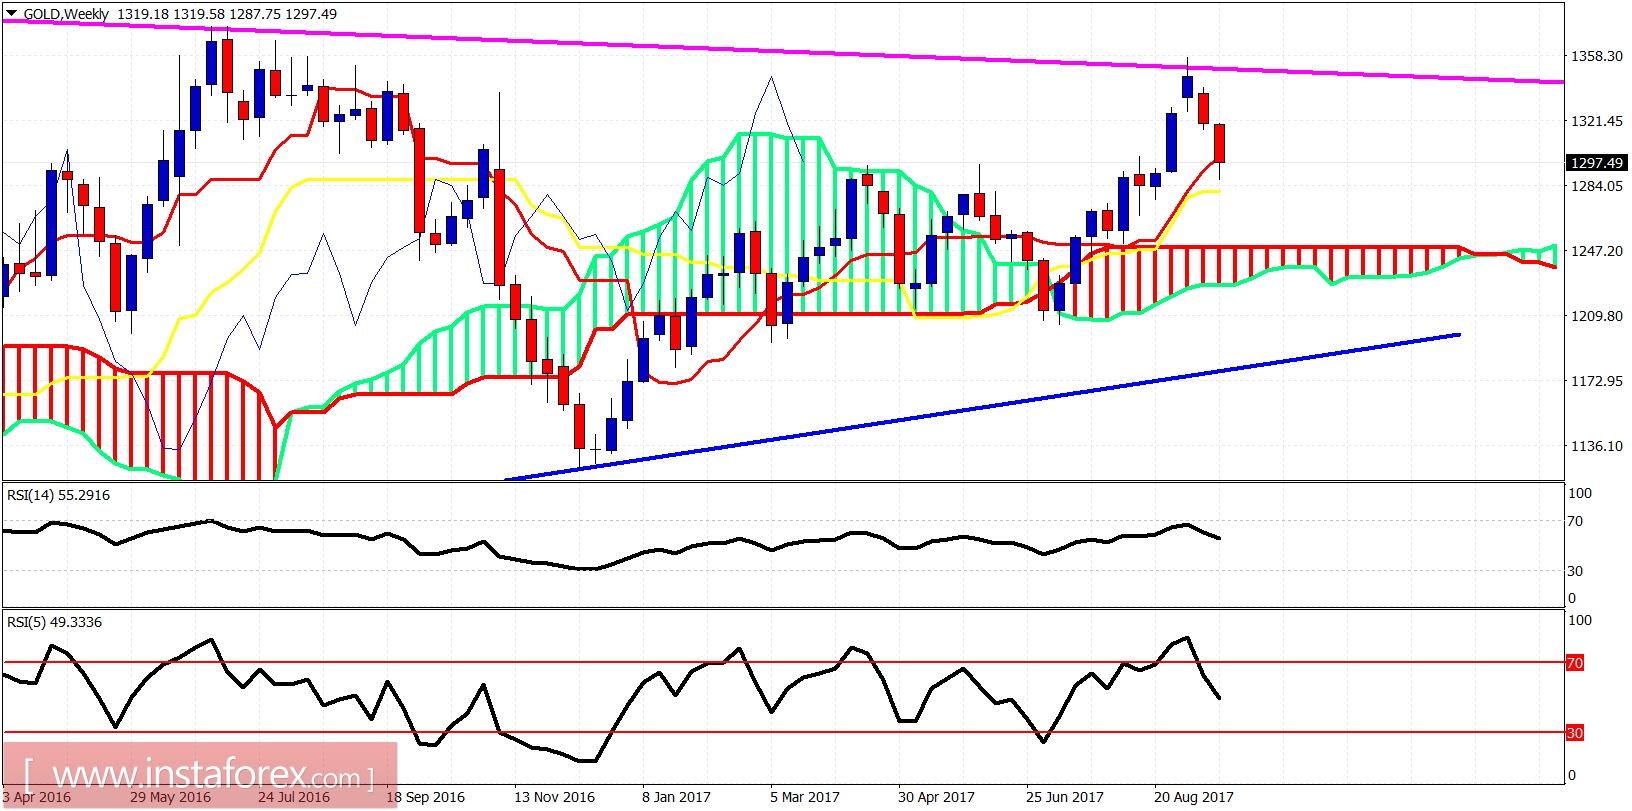
Blue line- long-term support
As we said a couple of months ago, Gold price would reach the resistance line at $1,350 and pull back for a correction before moving higher. This is exactly what is happening now and all we need to see now is a long tailed weekly candle. So this week's close could really signal something bullish for the next weeks. Gold is in a buying area as we mentioned in previous posts. We remain long-term bullish.