 English
  Русский
 Bahasa Indonesia
 Bahasa Malay
 ไทย
ไทย Español
 Deutsch
 Български
 Français
 Tiếng Việt
 中文
中文 বাংলা
বাংলা हिन्दी
 Čeština
 Українська
 Română

USDX received a boost from the Fed's decision to keep rates unchanged and by the hawkish tone of its statement. The 200 SMA on H1 chart remains as the dynamic support across the board and one could expect further gains to take place towards the resistance level of 93.09. To the downside, the nearest support is still located at the 91.67 level.
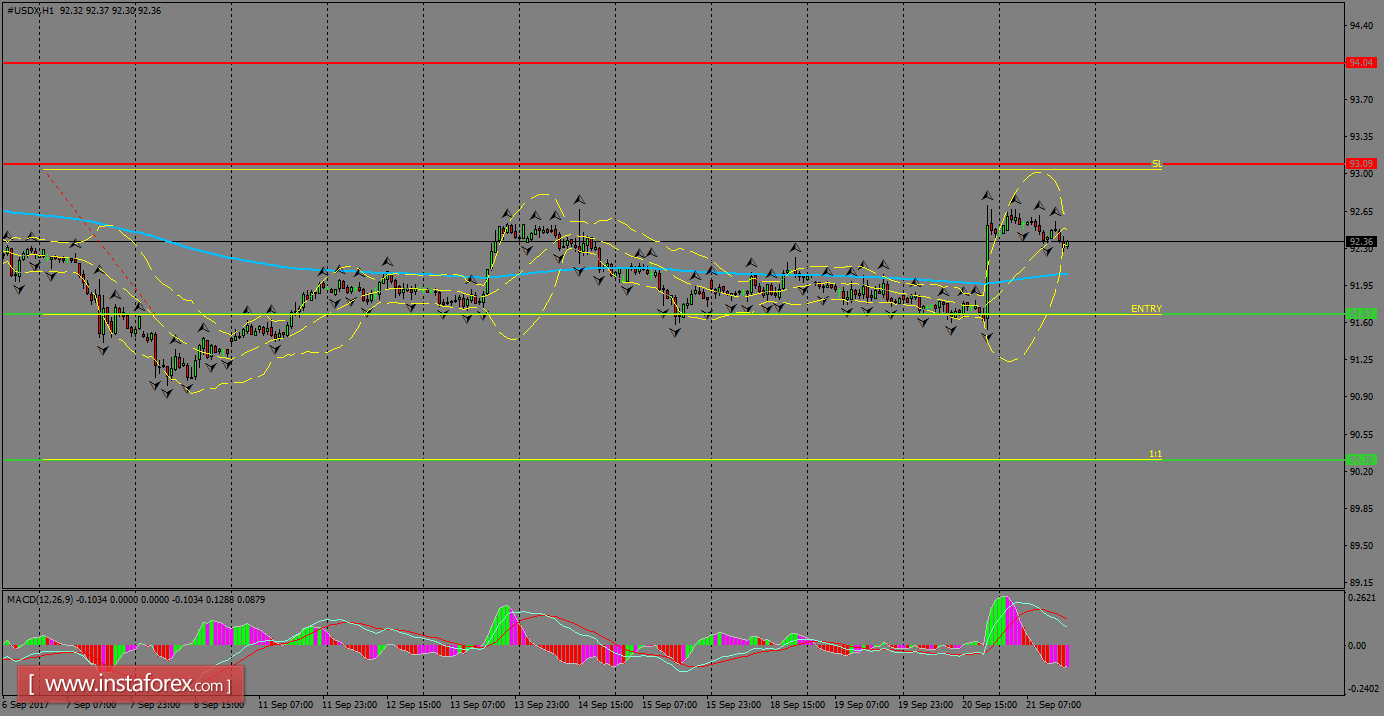
H1 chart's resistance levels: 93.09 / 94.04
H1 chart's support levels: 91.67 / 90.30
Trading recommendations for today: Based on the H1 chart, place sell (short) orders only if the USD Index breaks with a bearish candlestick; the support level is at 91.67, take profit is at 90.30 and stop loss is at 93.04.