 English
  Русский
 Bahasa Indonesia
 Bahasa Malay
 ไทย
ไทย Español
 Deutsch
 Български
 Français
 Tiếng Việt
 中文
中文 বাংলা
বাংলা हिन्दी
 Čeština
 Українська
 Română

GBP/USD has been trading sideways despite Fed's policy decision to keep its stance unchange. The pair is approaching the 200 SMA on H1 chart, where it could gather momentum in order to ride the bullish sequence towards the resistance level of 1.3755. Bollinger bands are tight, calling for a decisive move in the short term.
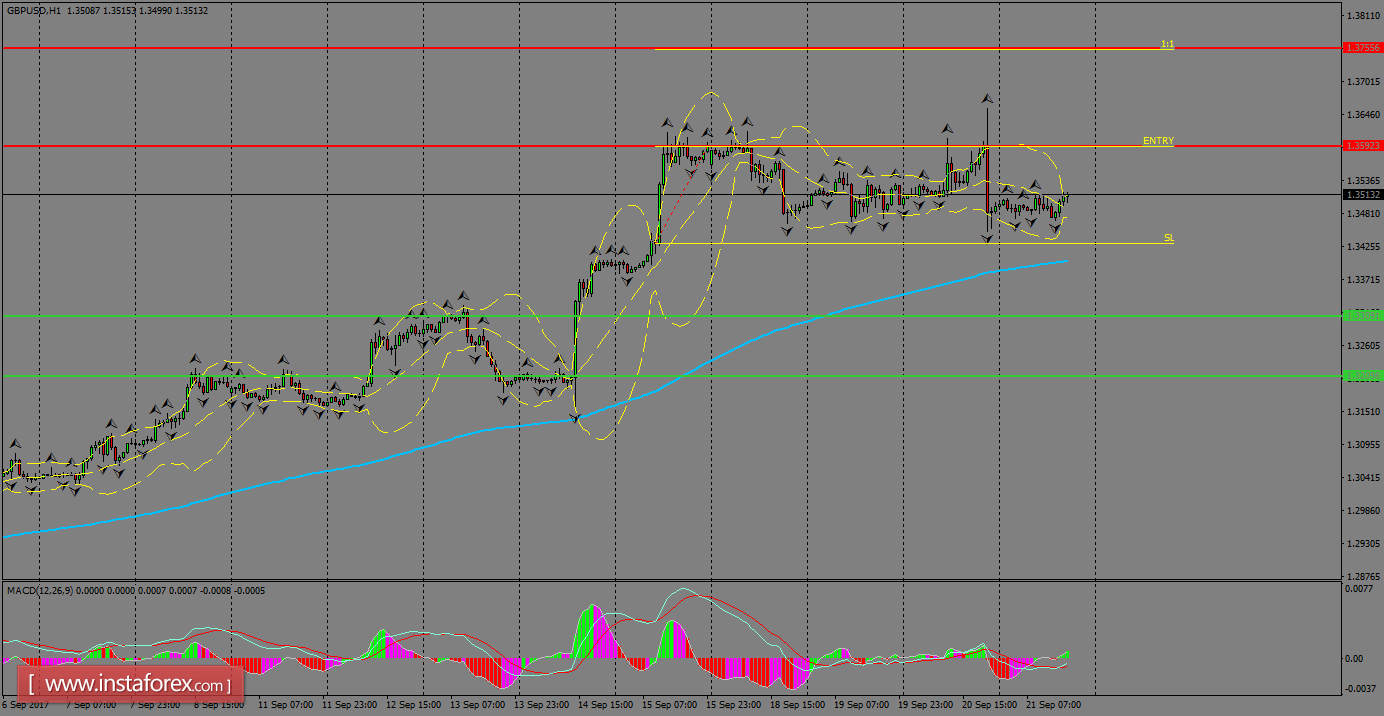
H1 chart's resistance levels: 1.3592 / 1.3755
H1 chart's support levels: 1.3309 / 1.3209
Trading recommendations for today: Based on the H1 chart, buy (long) orders only if the GBP/USD pair breaks a bullish candlestick; the resistance level is at 1.3592, take profit is at 1.3755 and stop loss is at 1.3430.