 English
  Русский
 Bahasa Indonesia
 Bahasa Malay
 ไทย
ไทย Español
 Deutsch
 Български
 Français
 Tiếng Việt
 中文
中文 বাংলা
বাংলা हिन्दी
 Čeština
 Українська
 Română

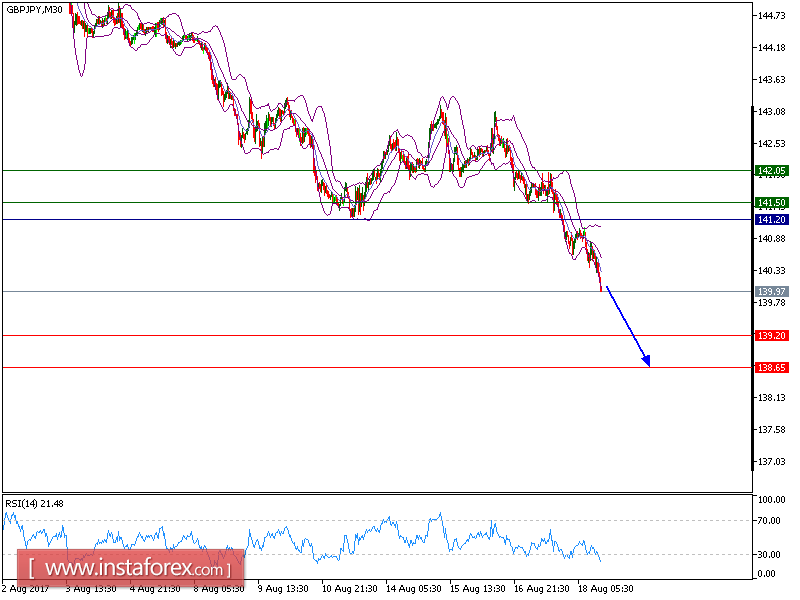
All our targets which we predicted yesterday were met. GBP/JPY is still under pressure and expected to continue the downside movement. The pair remains weak below its falling 20-period and 50-period moving averages, and is expected to post further downsides. The process of lower highs and lows remains intact, which should confirm a negative outlook. Besides, the relative strength index is still bearish, without showing any reversal signals.
To conclude, as long as 141.20 is not surpassed, the risk of a slide below 139.20 remains high. Our next down target is set at 138.65.
Alternatively, if the price moves in the opposite direction as predicted, a long position is recommended above 142.25 with the target at 142.65.
Strategy: SELL, Stop Loss: 139.20, Take Profit: 138.65.
Chart Explanation: the black line shows the pivot point. The price above the pivot point indicates the bullish position; and when it is below the pivot points, it indicates a short position. The red lines show the support levels and the green line indicates the resistance levels. These levels can be used to enter and exit trades.
Resistance levels: 141.50, 142.05, and 143.00
Support levels: 139.20, 138.65, and 138.00