 English
  Русский
 Bahasa Indonesia
 Bahasa Malay
 ไทย
ไทย Español
 Deutsch
 Български
 Français
 Tiếng Việt
 中文
中文 বাংলা
বাংলা हिन्दी
 Čeština
 Українська
 Română

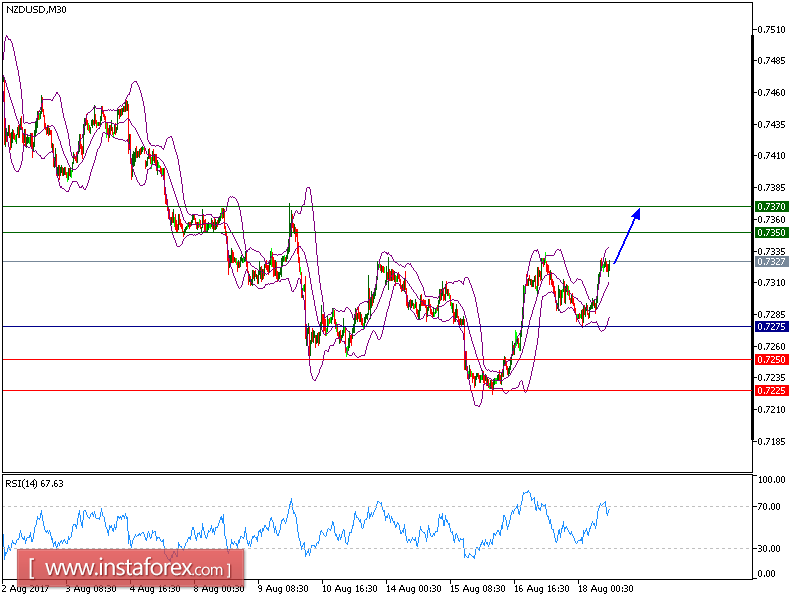
NZD/USD is expected to trade with bullish outlook above 0.7275. The technical picture of the pair is positive as the prices are supported by a bullish trend line. The upward momentum is further reinforced by both ascending 20-period and 50-period moving averages. The relative strength index is bullish and calls for a further upside.
Therefore, while the price holds above 0.7275, look for a new challenge to 0.7350 and even to 0.7370 in extension.
The black line shows the pivot point. Currently, the price is above the pivot point which indicates the bullish position. If it remains below the pivot point, it will indicate the short position. The red lines show the support levels and the green line indicates the resistance levels. These levels can be used to enter and exit trades.
Resistance levels: 0.7350, 0.7365, and 0.7400
Support levels: 0.7250, 0.7225, and 0.7175