 English
  Русский
 Bahasa Indonesia
 Bahasa Malay
 ไทย
ไทย Español
 Deutsch
 Български
 Français
 Tiếng Việt
 中文
中文 বাংলা
বাংলা हिन्दी
 Čeština
 Українська
 Română

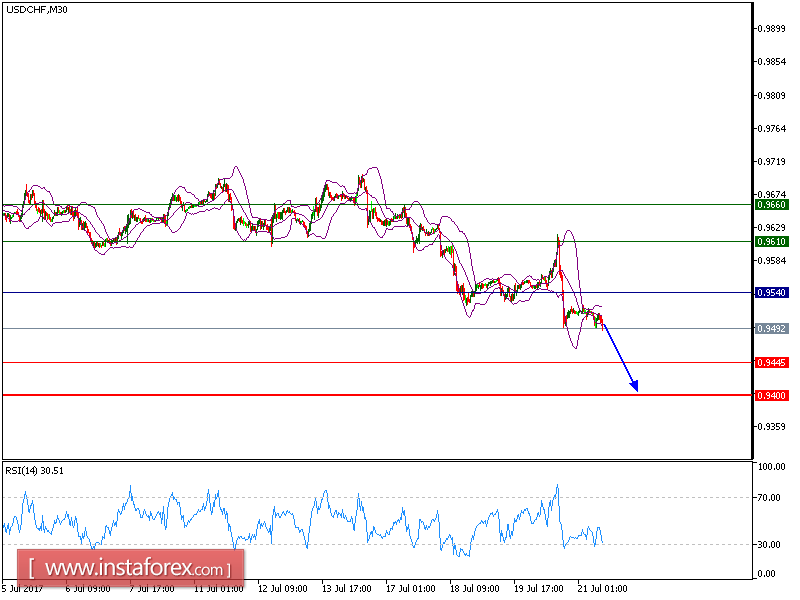
USD/CHF is under pressure, and we will keep our yesterday's scenario to hold short position. The pair is holding on the downside. The 20-period moving average crossed below the 50-period one, which indicated the bearish signal. The relative strength index is bearish and is calling for a further decline.
Hence, as long as 0.9540 is not surpassed, look for a new drop to 0.9445 and even to 0.9400 in extension.
Chart Explanation: The black line shows the pivot point; the present price above pivot point indicates the bullish position and below pivot points indicates the short position. The red lines show the support levels and the green line indicates the resistance levels. These levels can be used to enter and exit trades.
Strategy: SELL, Stop Loss: 0.9540, Take Profit: 0.9445
Resistance levels: 0.9610, 0.9660, and 0.9695
Support levels: 0.9445, 0.9400, and 0.9365