 English
  Русский
 Bahasa Indonesia
 Bahasa Malay
 ไทย
ไทย Español
 Deutsch
 Български
 Français
 Tiếng Việt
 中文
中文 বাংলা
বাংলা हिन्दी
 Čeština
 Українська
 Română

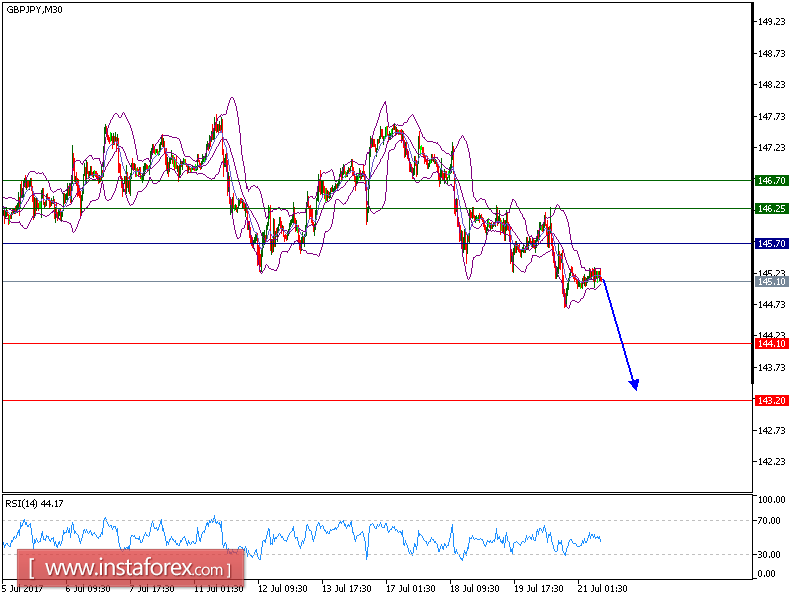
Our target which we predicted in yesterday's analysis has been hit. GBP/JPY is still under pressure. The pair is rebounding and has broken above its declining 20-period moving average.
The relative strength index is above its neutrality level at 50. Nevertheless, 145.70 is playing a key resistance role, which should limit the upside potential.
As long as 145.70 holds on the upside, expect a return to 144.10. A break below this level would call for a further decline towards 143.20.
Alternatively, if the price moves in the opposite direction as predicted, a long position is recommended above 145.70 with the target at 146.25.
Chart Explanation: the black line shows the pivot point. The price above pivot point indicates the bullish position and when it is below pivot points, it indicates a short position. The red lines show the support levels and the green line indicates the resistance levels. These levels can be used to enter and exit trades.
Strategy: SELL, Stop Loss: 145.70, Take Profit: 144.10.
Resistance levels: 146.25, 146.70, and 147.15
Support levels: 144.10, 143.20, and 142.45.