 English
  Русский
 Bahasa Indonesia
 Bahasa Malay
 ไทย
ไทย Español
 Deutsch
 Български
 Français
 Tiếng Việt
 中文
中文 বাংলা
বাংলা हिन्दी
 Čeština
 Українська
 Română

The Dollar index has made new lower lows towards 95 as expected after breaking 96.50. This level is now important support. Trend is clearly bearish.
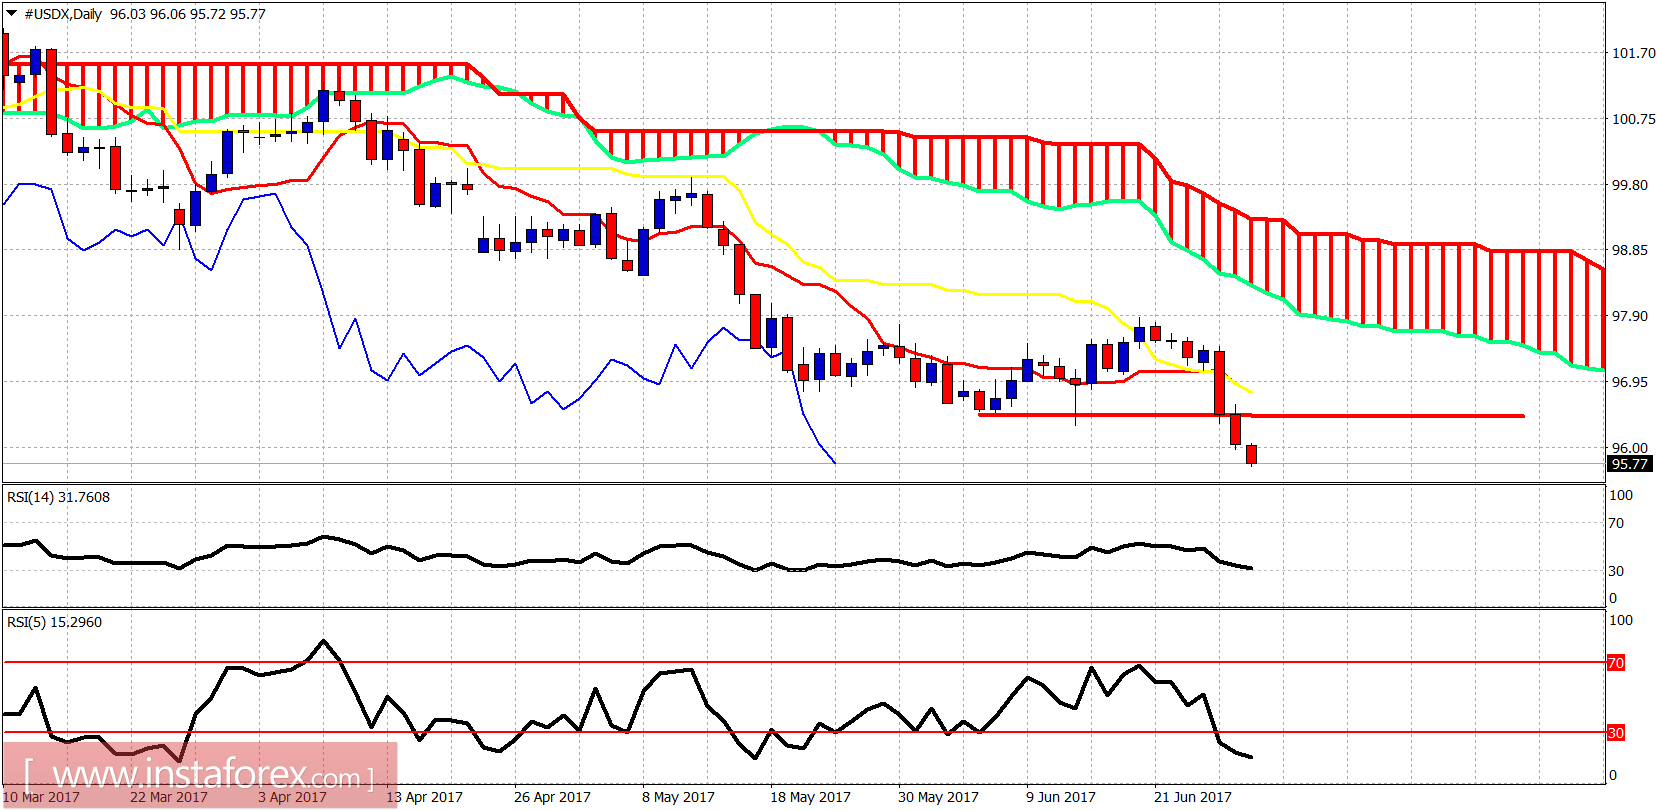
Price in the daily chart is below the tenkan- and kijun-sen indicators. Price is making lower lows and lower highs. Oscillators are oversold. Support now at 95. Resistance at 96.50.
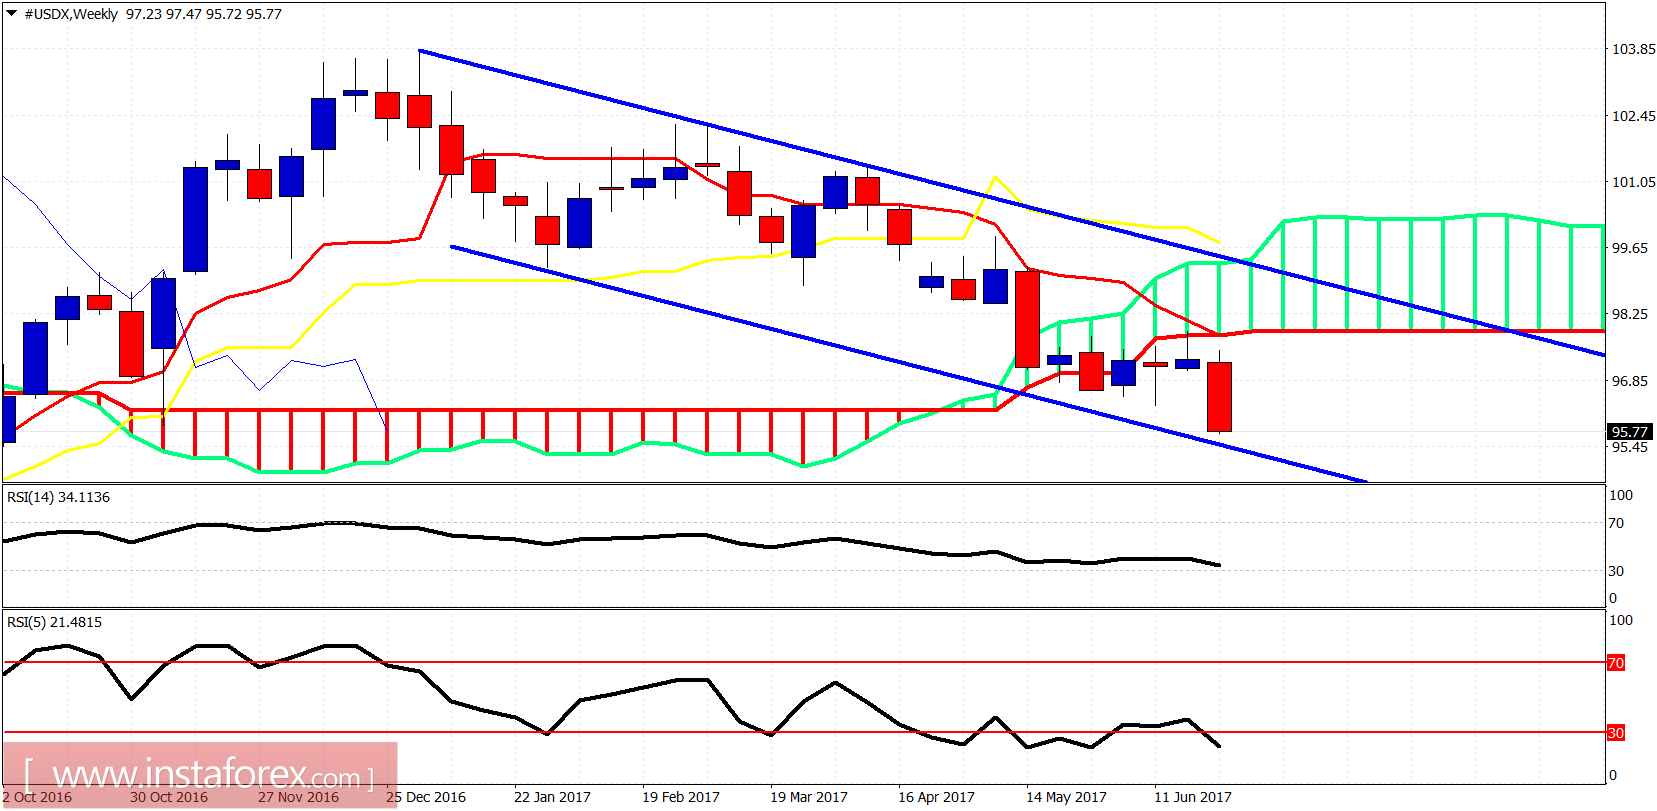
Price approaching the lower channel boundary again. RSI (5) oversold and diverging. Weekly trend is bearish as price is below the Kumo. Important weekly resistance is now at 98. Channel resistance is at 98.50.