English
  Русский
 Bahasa Indonesia
 Bahasa Malay
 ไทย
ไทย Español
 Deutsch
 Български
 Français
 Tiếng Việt
 中文
中文 বাংলা
বাংলা हिन्दी
 Čeština
 Українська
 Română

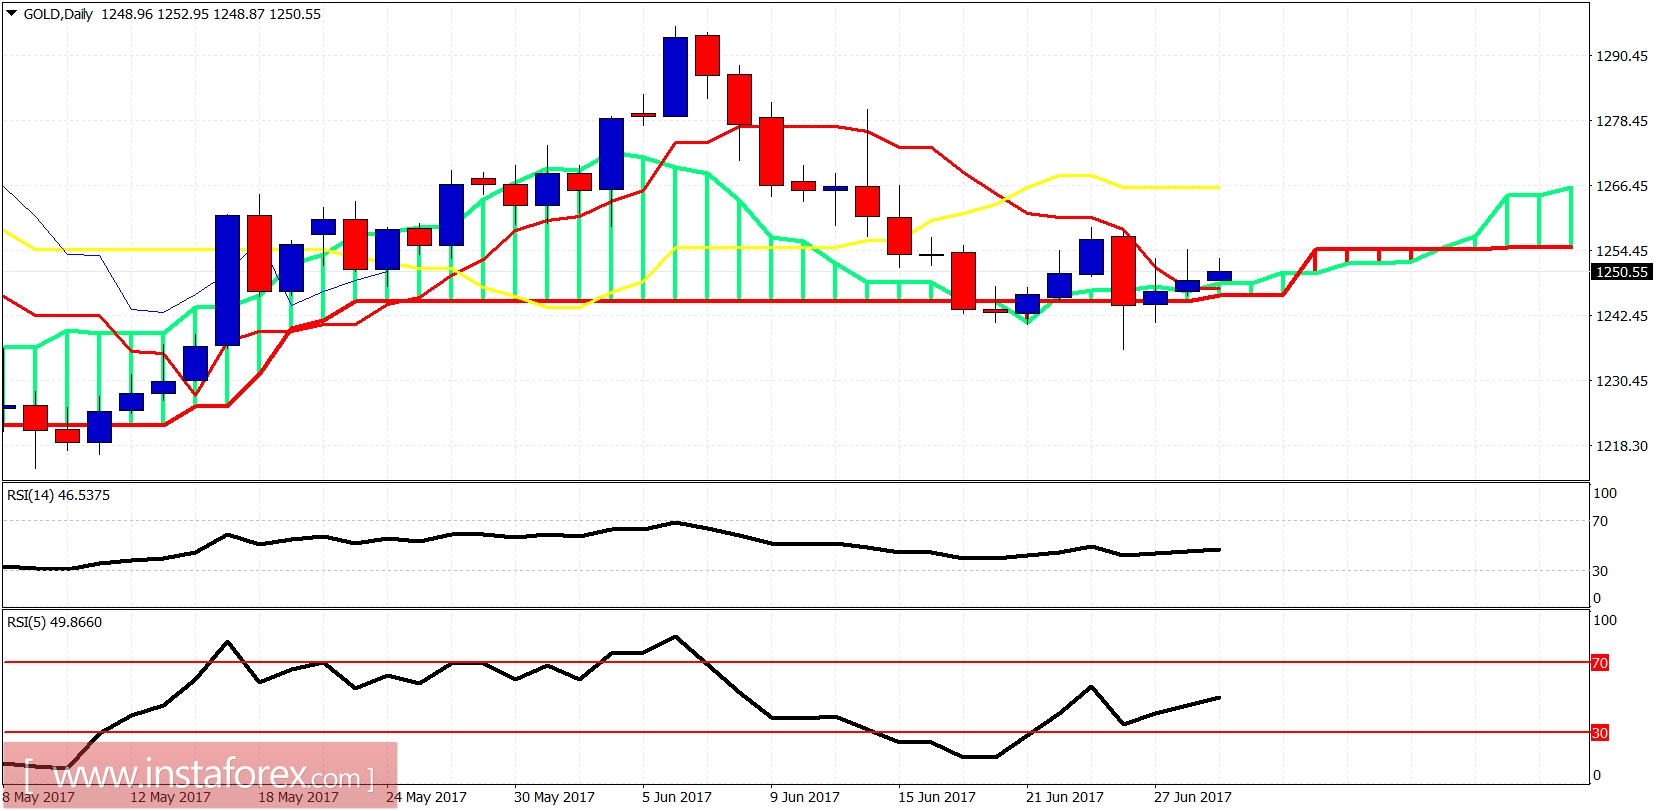
Gold price remains below the $1,260 level. As long as the 4-hour chart is below this level we are in danger of a rejection and push lower towards $1,230. Bulls need to break resistance soon and make a move towards $1,280-90.
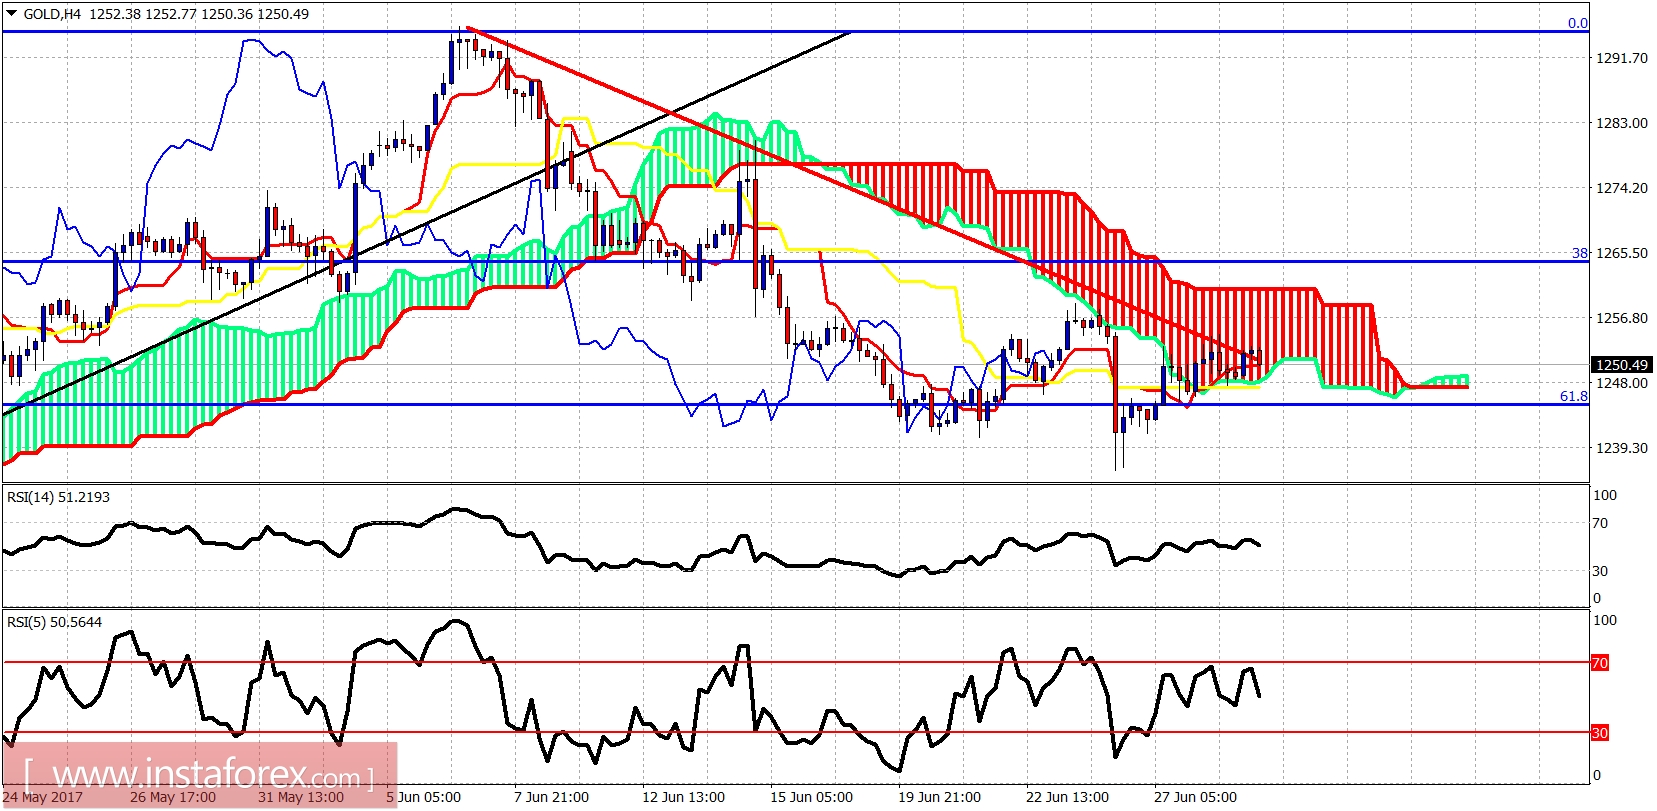
The gold price has entered the 4-hour Kumo. The trend is neutral. However, bulls need to break above $1,260 in order for the short-term trend to change to bullish. Support is at $1,250. Breaking it will open the way for a move towards $1,239 and lower.