English
  Русский
 Bahasa Indonesia
 Bahasa Malay
 ไทย
ไทย Español
 Deutsch
 Български
 Français
 Tiếng Việt
 中文
中文 বাংলা
বাংলা हिन्दी
 Čeština
 Українська
 Română

Overview:
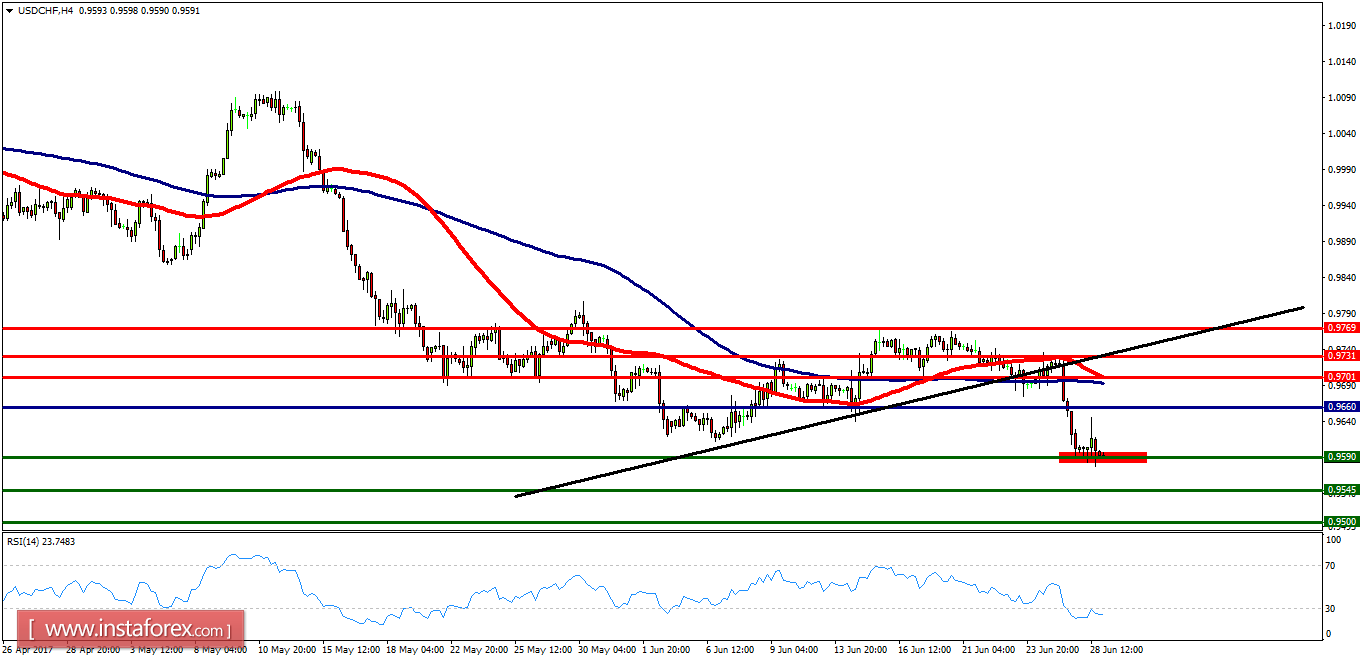
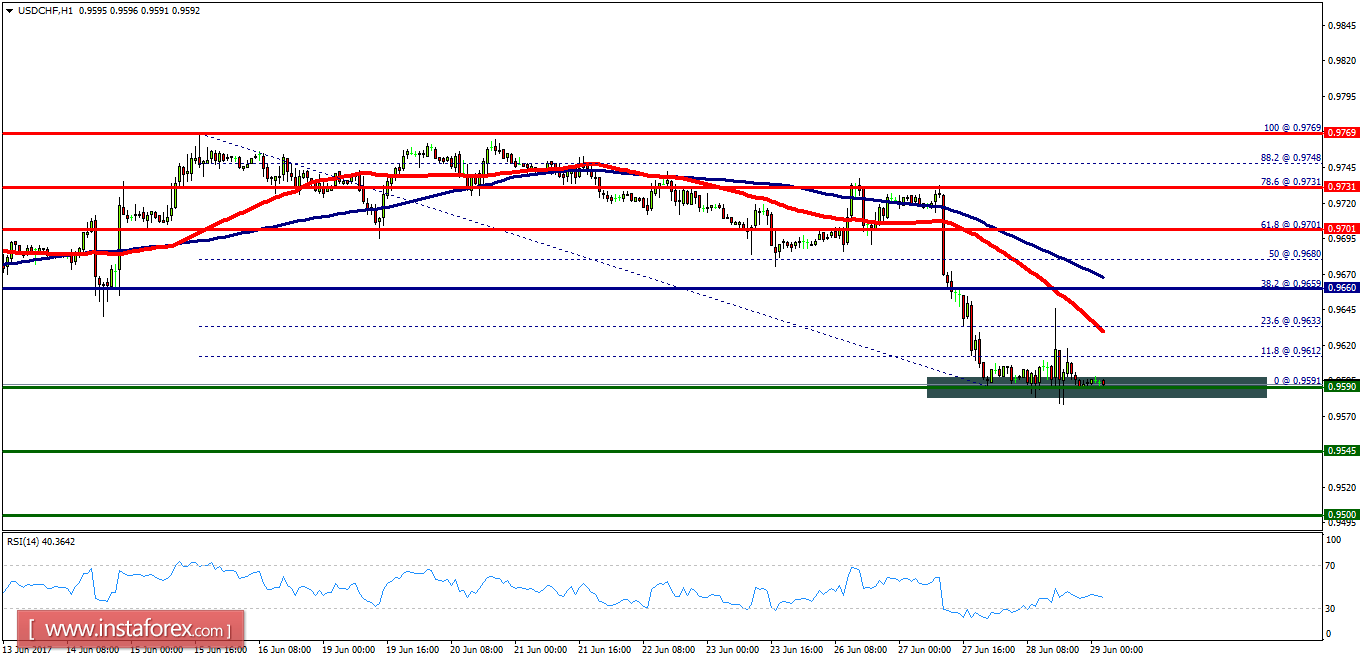
- The USD/CHF pair continues moving downwards from the level of 0.9701. Yesterday, the pair dropped from the level of 0.9701(this level of 0.9701 coincides with the ratio of 61.8% Fibonacci retracement) to the bottom around 0.9591. Today, the first resistance level is seen at 0.9660 followed by 0.9701, while daily support 1 is seen at 0.9545. According to the previous events, the USD/CHF pair is still moving between the levels of 0.9660 and 0.9545; for that, we expect a range of 115 pips (0.9660 - 0.9545).
- If the USD/CHF pair fails to break through the resistance level of 0.9545, the market will decline further to 0.9500 in coming days. This would suggest a bearish market because the RSI indicator is still in a positive area and does not show any trend reversal signs. On the contrary, if a breakout takes place at the resistance level of 0.9731, then this scenario may become invalidated. Also, it should be noted that the price is still trading around the spot of 0.9590.