 English
  Русский
 Bahasa Indonesia
 Bahasa Malay
 ไทย
ไทย Español
 Deutsch
 Български
 Français
 Tiếng Việt
 中文
中文 বাংলা
বাংলা हिन्दी
 Čeština
 Українська
 Română

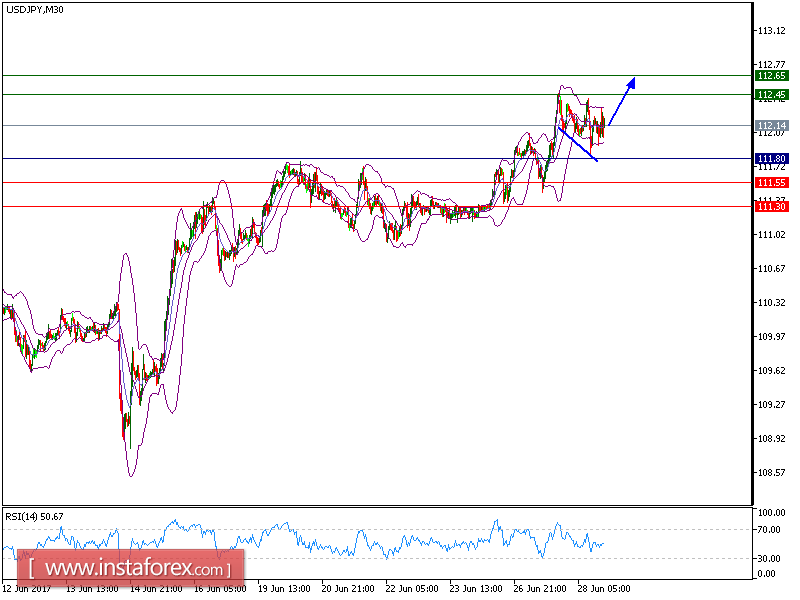
Our both targets which we predicted for USD/JPY in the analysis from 26th June have been hit. The pair is expected to continue its upside movement. Although the pair retreated from 112.45 (the high of June 27), a support base at 112.00 has been formed and has allowed for a temporary stabilization. The rising 20-period and 50-period are playing support roles. The relative strength index is above it neutrality level at 50.
Hence, as long as 111.80 is not broken, look for a further rise to 112.45 and even to 112.65 in extension.
Alternatively, if the price moves in the opposite direction as predicted, short position is recommended below 111.80 with targets at 111.55 and 111.35.
Chart Explanation: The black line shows the pivot point. The present price above pivot point indicates the bullish position while the price below pivot point indicates the short position. The red lines show the support levels and the green line indicates the resistance levels. These levels can be used to enter and exit trades.
Strategy : BUY, Stop Loss: 111.80, Take Profit: 112.45
Resistance levels: 112.45, 112.65, and 113.00
Support levels: 111.55,111.30, and 111.00