 English
  Русский
 Bahasa Indonesia
 Bahasa Malay
 ไทย
ไทย Español
 Deutsch
 Български
 Français
 Tiếng Việt
 中文
中文 বাংলা
বাংলা हिन्दी
 Čeština
 Українська
 Română

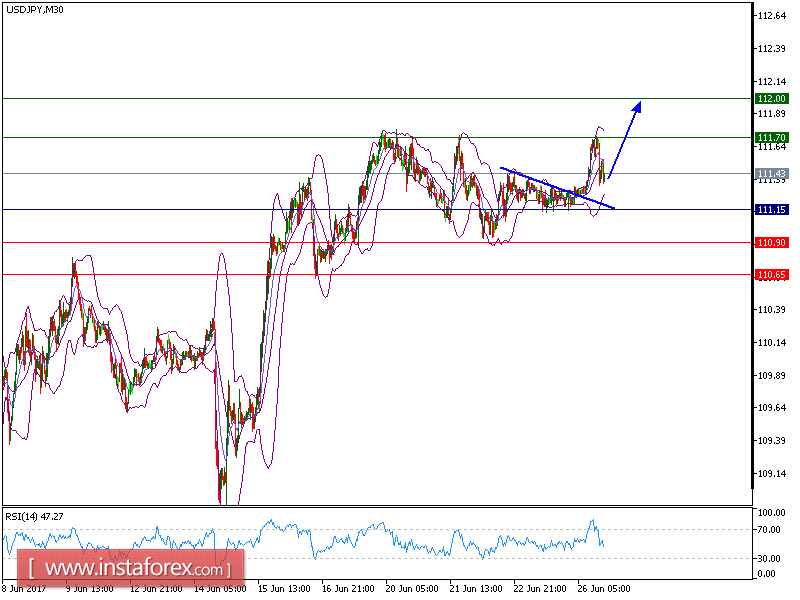
USD/JPY is expected to trade with a bullish bias above 111.15. The technical picture of the pair is positive as the prices broke above the declining trend line. The upward momentum is further reinforced by the rising 50-period moving average. The relative strength index is mixed with bullish bias.
Hence, above 111.15, expect a new advance with targets at 111.70 and 112 in extension
Alternatively, if the price moves in the opposite direction as predicted, short position is recommended below 111.15 with targets at 110.90 and 110.65.
Chart Explanation: The black line shows the pivot point. The present price above pivot point indicates the bullish position while the price below pivot point indicates the short position. The red lines show the support levels and the green line indicates the resistance levels. These levels can be used to enter and exit trades.
Strategy : BUY, Stop Loss: 111.15, Take Profit: 111.70
Resistance levels: 111.70, 112.00, and 112.50
Support levels: 110.90,110.65, and 110.35