 English
  Русский
 Bahasa Indonesia
 Bahasa Malay
 ไทย
ไทย Español
 Deutsch
 Български
 Français
 Tiếng Việt
 中文
中文 বাংলা
বাংলা हिन्दी
 Čeština
 Українська
 Română

The Dollar index is weakening. Price is breaking below support and this is not a good sign. The bounce we were expecting was shallow. If price breaks below 97, we should expect more selling pressures to push the index to new monthly lows.
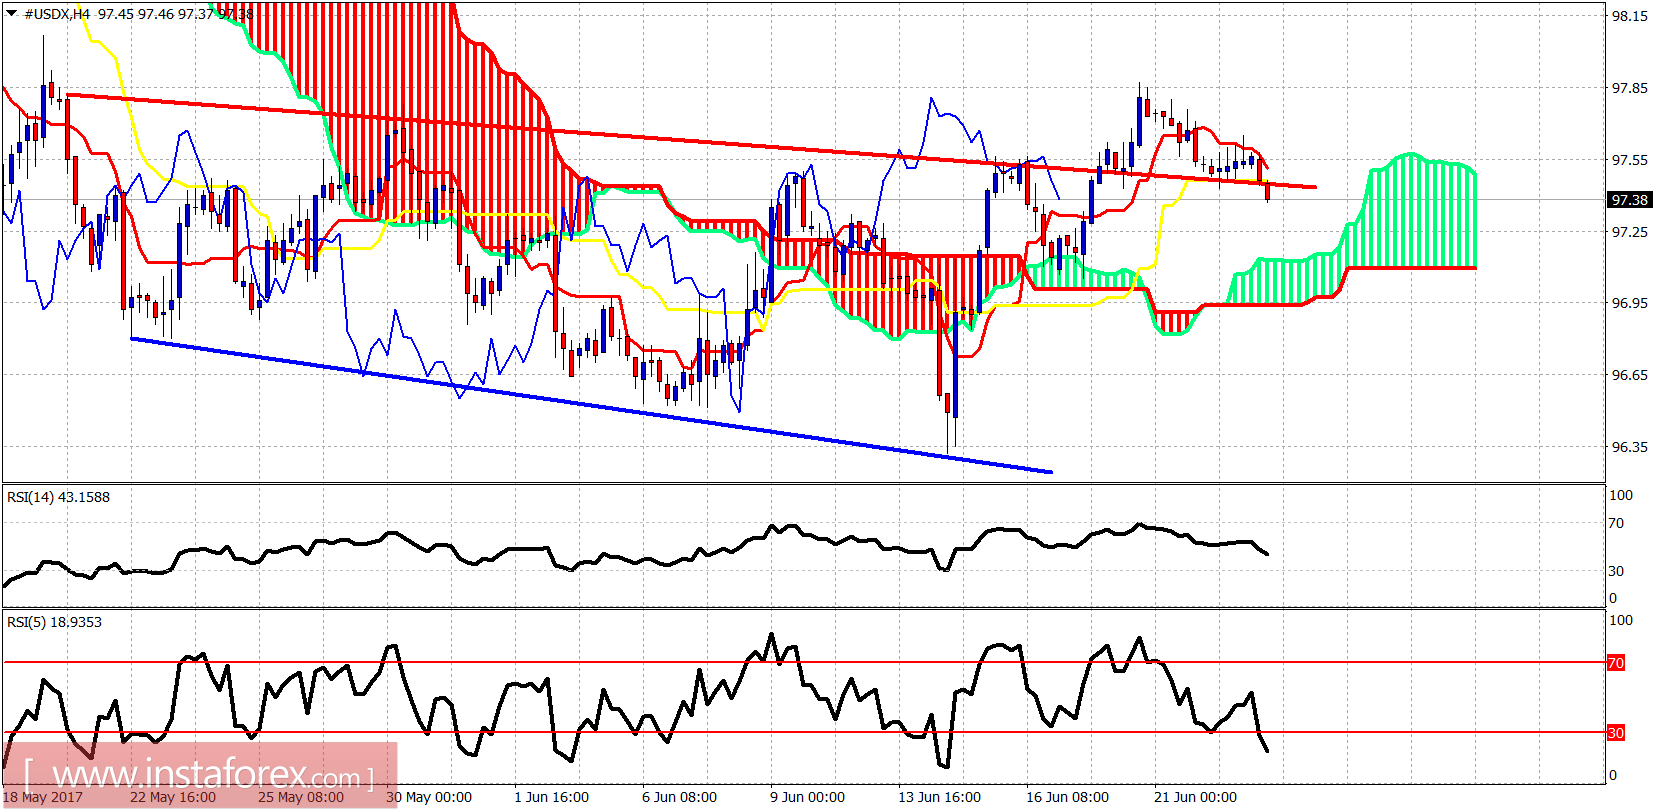
Blue line- support
The Dollar index has broken below both the tenkan- and kijun-sen indicators. Price is heading towards Kumo (cloud) support at 97.15-97. Breaking below the 4-hour Kumo will turn trend back to bearish and will bring more sellers and push price towards 95-94.
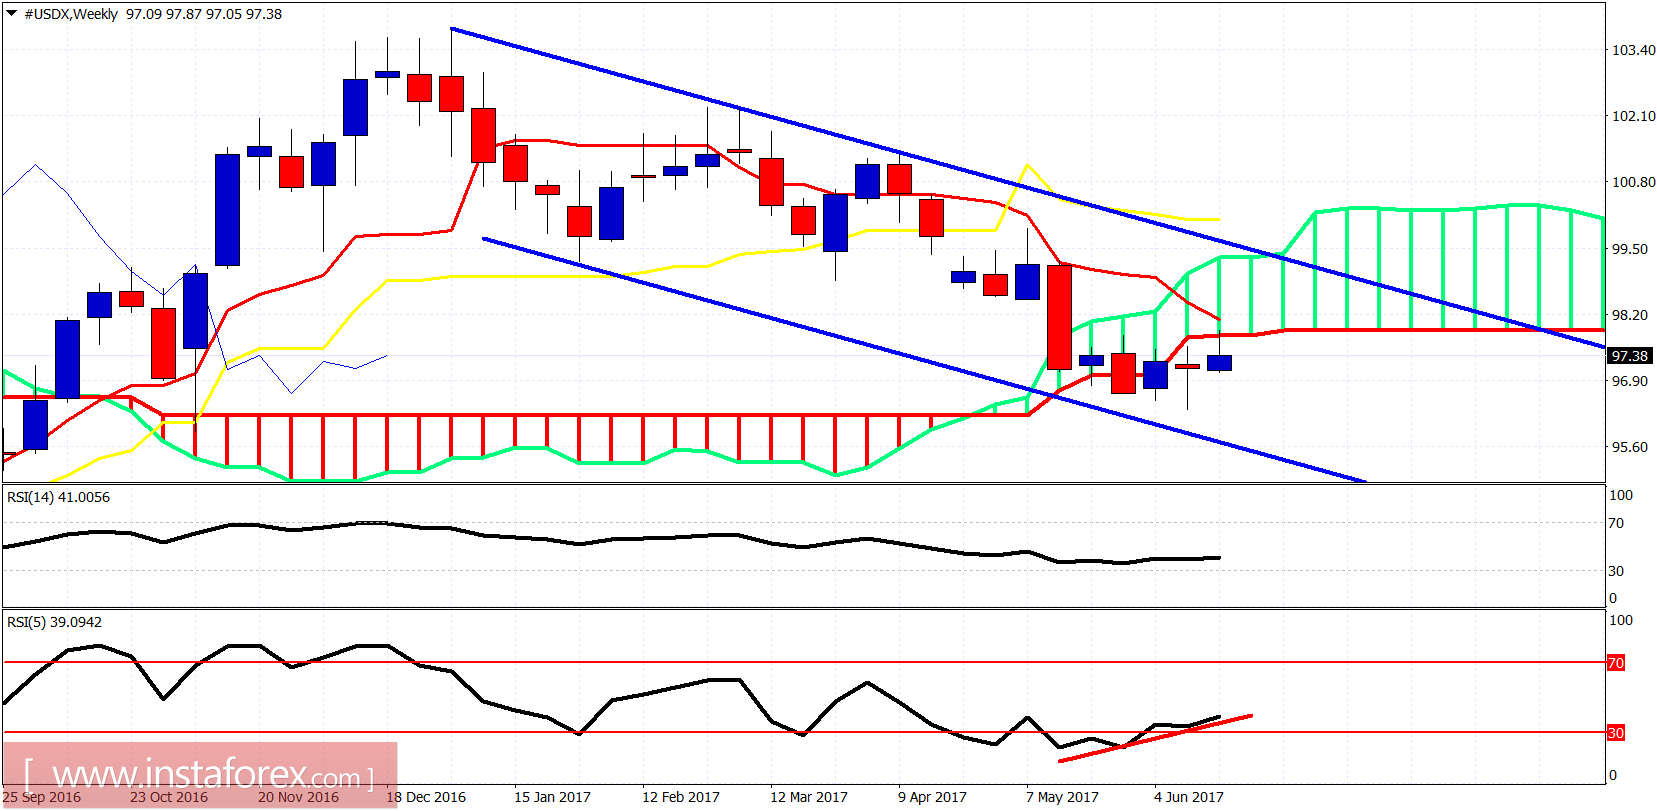
The weekly price action remains inside a bearish channel. Weekly candle got rejected at the lower Kumo (cloud) boundary resistance. This rejection is not a good sign. Bulls need to make a new weekly high to remain in control and to continue to hope for a move towards 98.50-99. The rejection has however brought a new scenario where we see a new weekly low and then reverse.