 English
  Русский
 Bahasa Indonesia
 Bahasa Malay
 ไทย
ไทย Español
 Deutsch
 Български
 Français
 Tiếng Việt
 中文
中文 বাংলা
বাংলা हिन्दी
 Čeština
 Українська
 Română

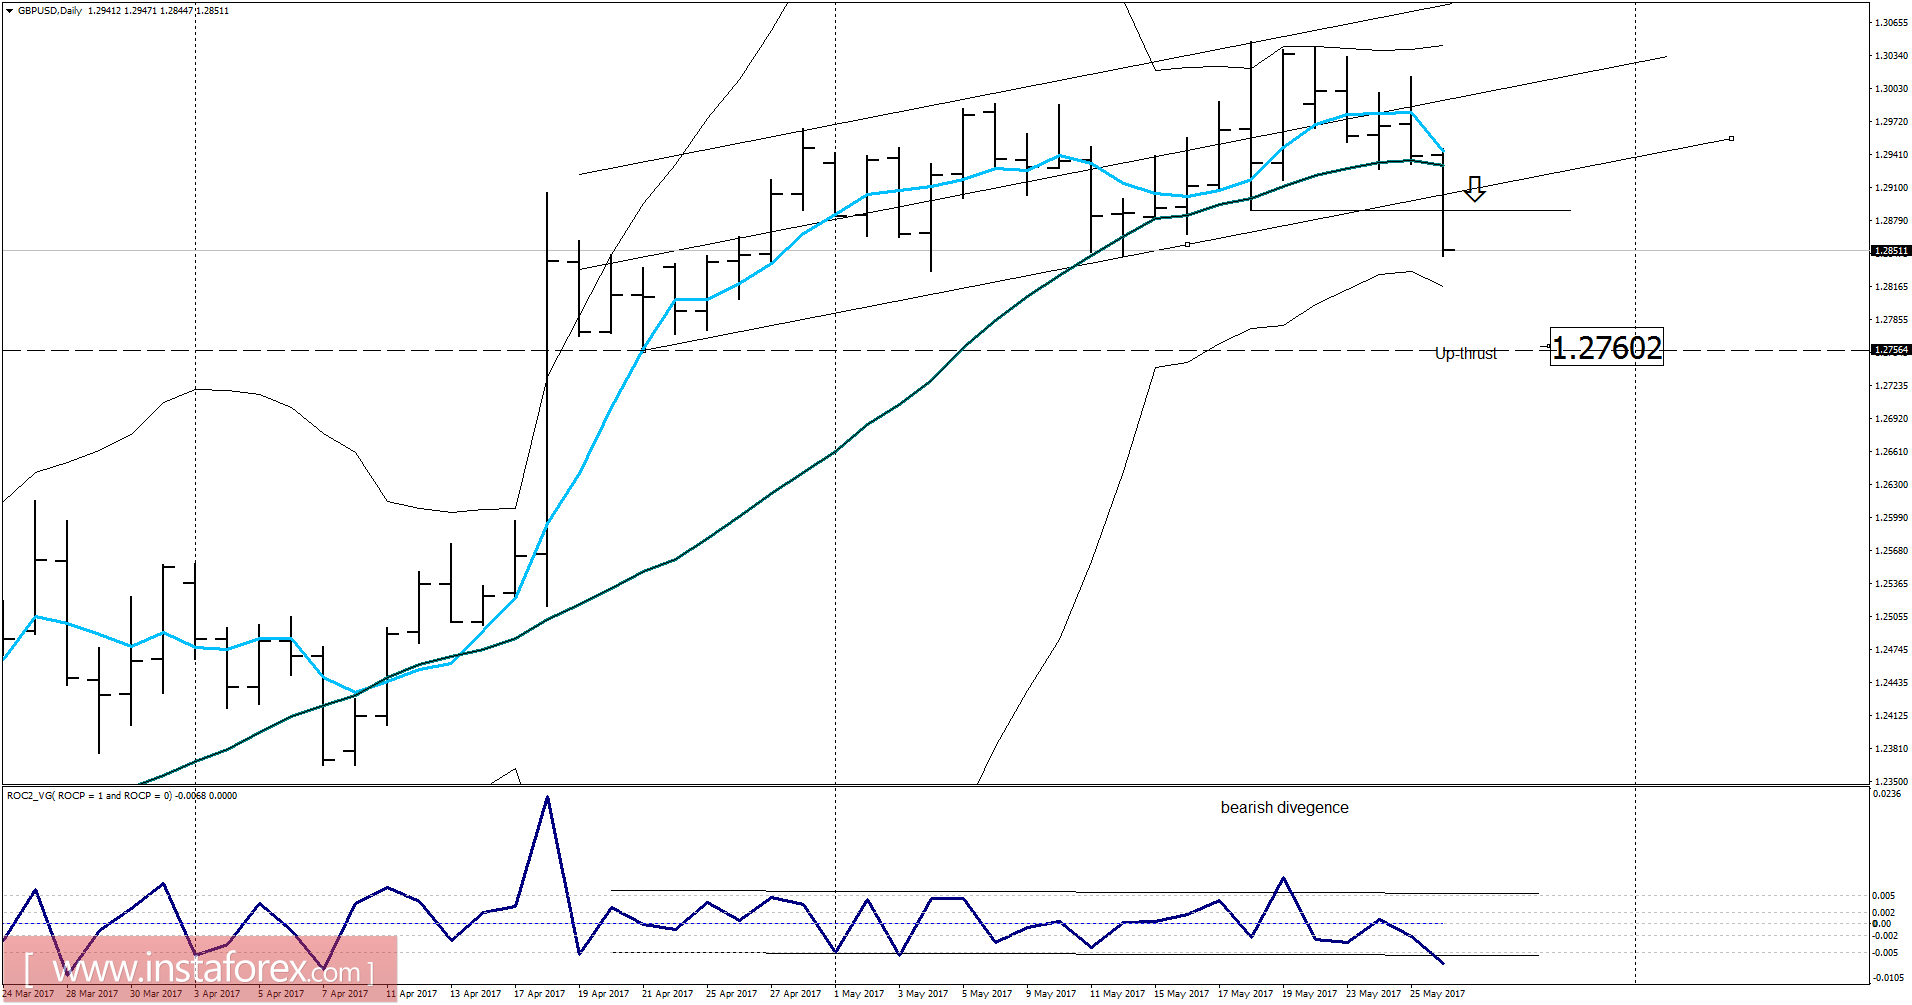
Recently, the GBP/USD pair has been trading downwards. The price tested the level of 1.2844. According to the Daily time frame, I found that price broke a sideways channel, which is a sign that sellers took control over the market. There is also a breakout of inside bar formation, which is another sign of weakness. My advice is to watch for potential selling opportunities. The downward target is set at the price of 1.2760.
Resistance levels:
R1: 1.2990
R2: 1.3015
R3: 1.3045
Support levels:
S1: 1.2930
S2: 1.2910
S3: 1.2875
Trading recommendations for today: consider potential selling opportunities.