 English
  Русский
 Bahasa Indonesia
 Bahasa Malay
 ไทย
ไทย Español
 Deutsch
 Български
 Français
 Tiếng Việt
 中文
中文 বাংলা
বাংলা हिन्दी
 Čeština
 Українська
 Română

The Dollar index remains in a bearish channel. Trend remains bearish. I favor a dollar bounce this week from current levels but we still have no confirmation of a reversal.
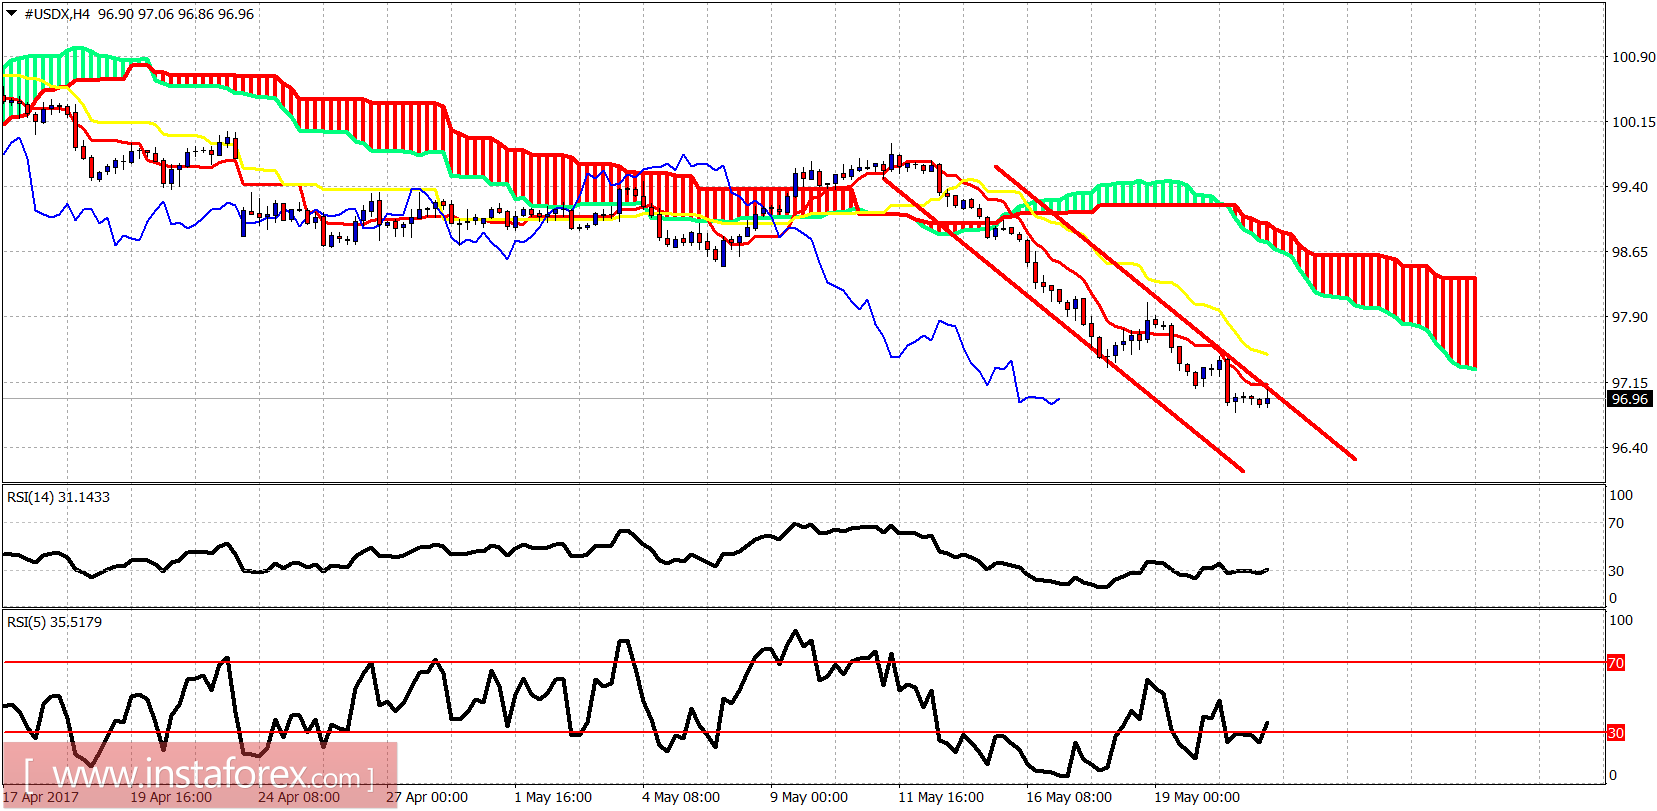
Short-term resistance by the tenkan- sen is at 97.12 and by the kijun-sen at 97.47. Cloud resistance and target of the bounce expected is at 98.60-99. The RSI is diverging on the 4-hour chart.
Green line - long-term trend line support (broken)
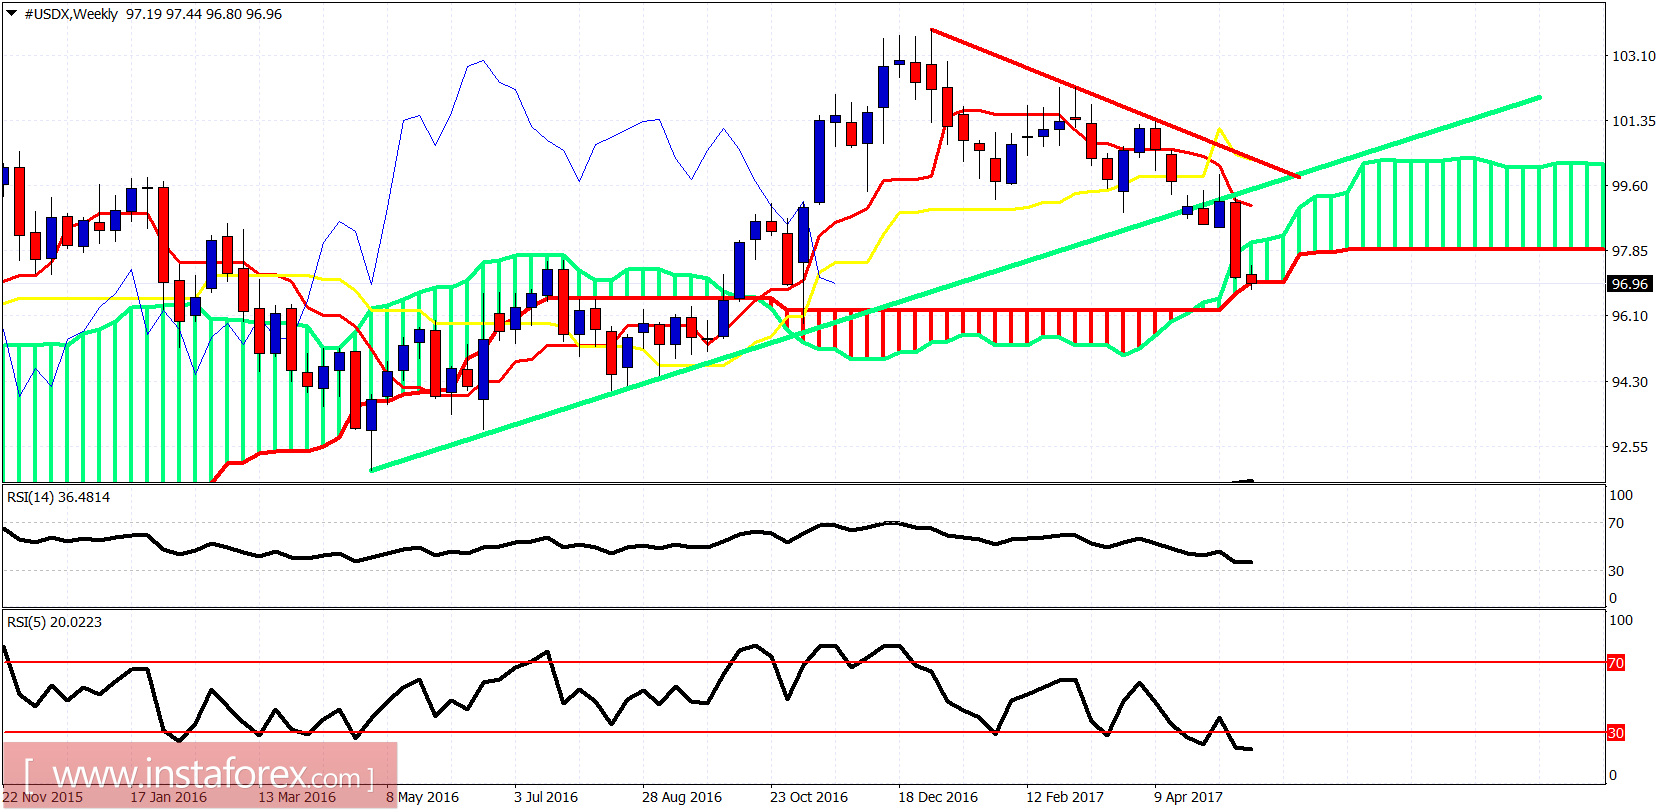
The weekly candle is testing the weekly Kumo support at 96.90-97 area. The RSI is oversold on a weekly basis. This is not the time be shorting but to be looking reversal signs. The bounce that will come will give a better opportunity and a better selling price level higher. Traders need to be patient. Aggressive traders will also look to play the bounce once we get the first short-term reversal signals.