Gold price remains just below the important resistance of $1,265 where the 61.8% Fibonacci retracement is found. Trend remains bullish but a pullback towards $1,250 is justified in the short term. As long as price is above $1,213, I expect Gold to reach $1,280-$1,300.
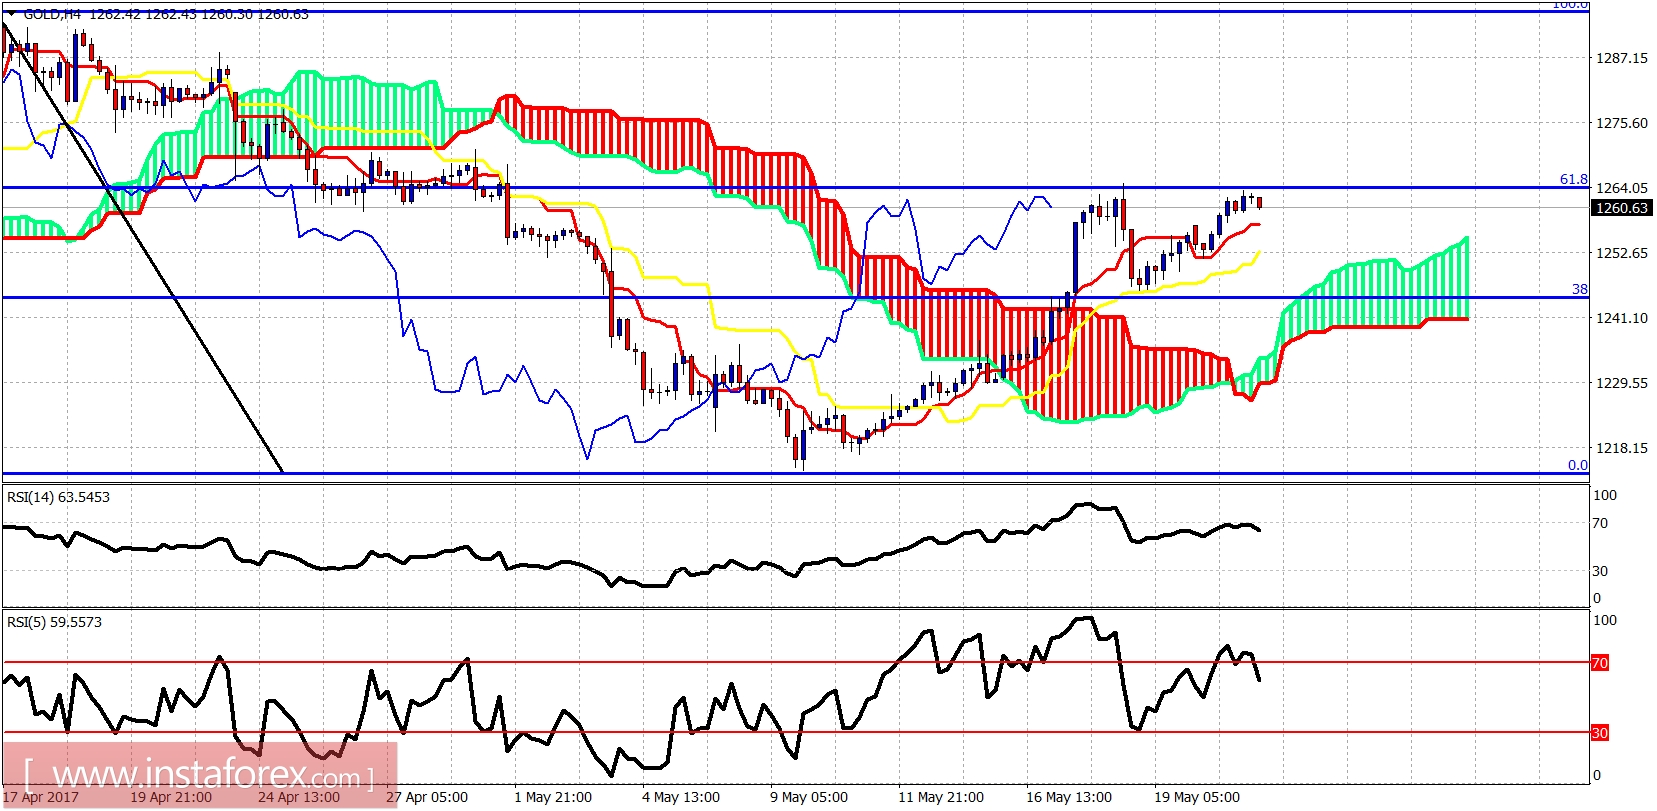
Gold price continues to trade above both the tenkan- and kijun-sen indicators. Support is at $1,257 and at $1,252. Resistance at $1,265. Cloud support is at $1,230.
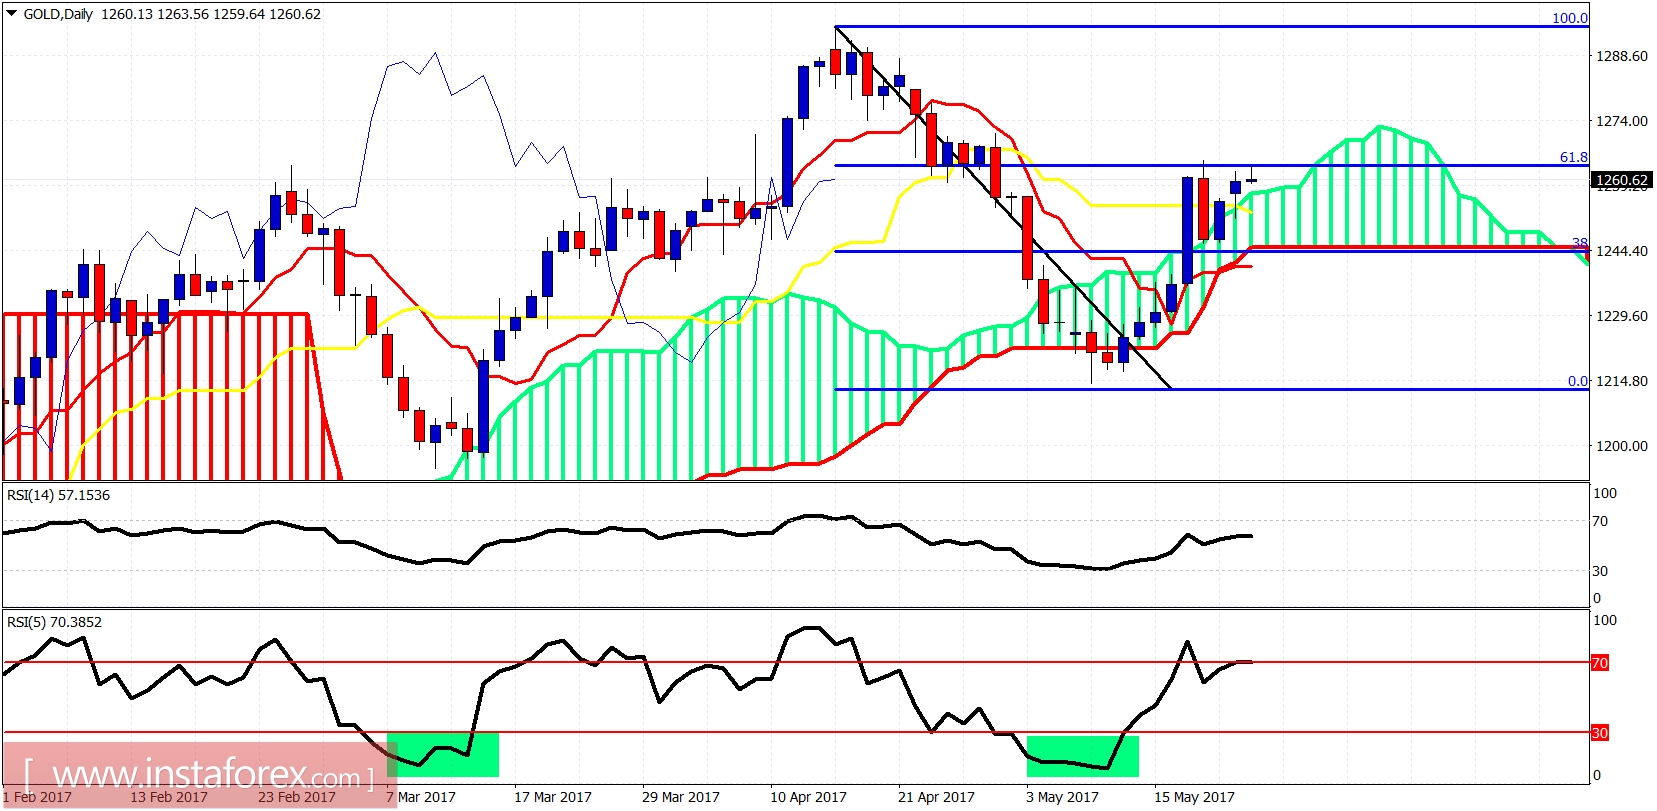
Gold daily candle remains above the cloud and above the daily kijun-sen at $1,253. Gold price rise has stopped at the 61.8% Fibonacci retracement. Gold resistance is here. I expect at least a short-term pullback and then more upside. The bearish scenario of a move towards $1,150-60 will happen only on a break below $1,213.
*The market analysis posted here is meant to increase your awareness, but not to give instructions to make a trade
 English
  Русский
 Bahasa Indonesia
 Bahasa Malay
 ไทย
ไทย Español
 Deutsch
 Български
 Français
 Tiếng Việt
 中文
中文 বাংলা
বাংলা हिन्दी
 Čeština
 Українська
 Română
