 English
  Русский
 Bahasa Indonesia
 Bahasa Malay
 ไทย
ไทย Español
 Deutsch
 Български
 Français
 Tiếng Việt
 中文
中文 বাংলা
বাংলা हिन्दी
 Čeština
 Українська
 Română

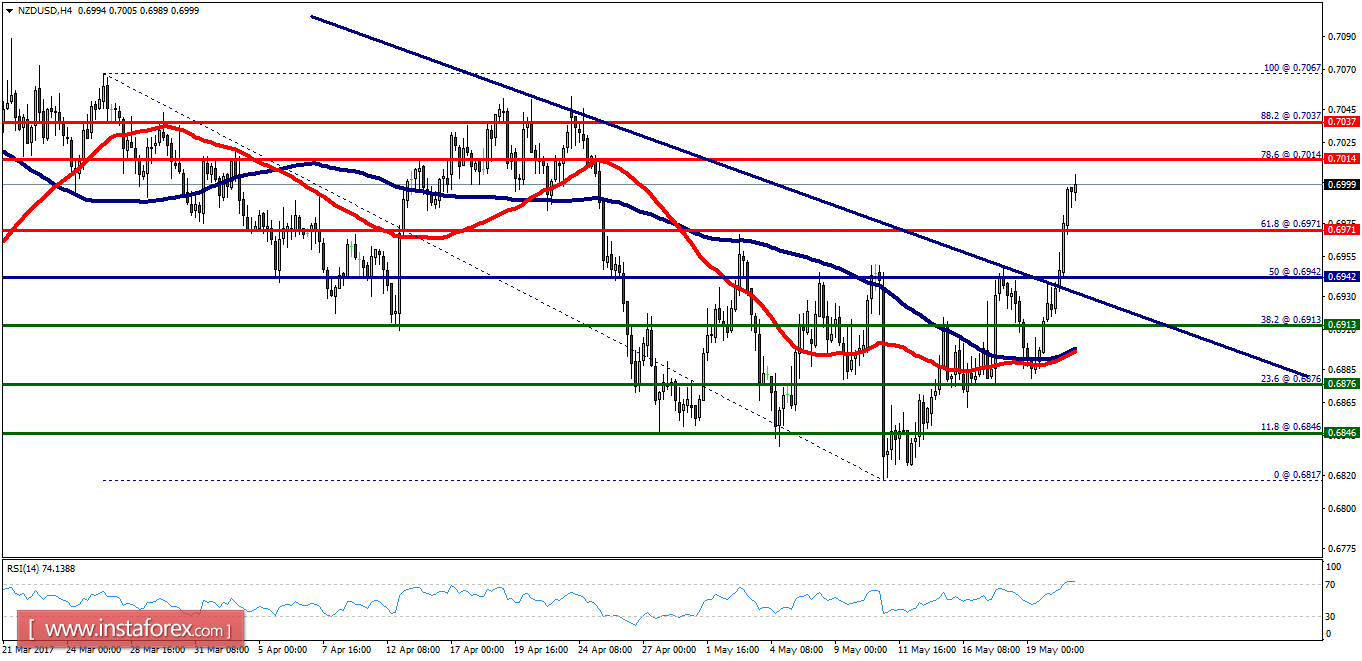
Overview:
- The NZD/USD pair continues to move upwards from the level of 0.6942. Yesterday, the pair rose from the level of 0.6942 (the level of 0.9866 coincides with a ratio of 50% Fibonacci retracement) to a top around 0.7000. Today, the first support level is seen at 0.6942 followed by 0.6913, while daily resistance 1 is seen at 0.7037. According to the previous events, the NZD/USD pair is still moving between the levels of 0.7037 and 0.6942; for that we expect a range of 95 pips (0.7037 - 0.6942). On the one-hour chart, immediate resistance is seen at 0.7014, which coincides with a ratio of 78.6% Fibonacci retracement. Currently, the price is moving in a bullish channel. This is confirmed by the RSI indicator signaling that we are still in a bullish trending market. The price is still above the moving average (100) and (50), Therefore, if the trend is able to break out through the first resistance level of 0.7073, we should see the pair climbing towards the double top at the level of 0.7067 to test it. It would also be wise to consider where to place stop loss; this should be set below the second support of 0.6913.