 English
  Русский
 Bahasa Indonesia
 Bahasa Malay
 ไทย
ไทย Español
 Deutsch
 Български
 Français
 Tiếng Việt
 中文
中文 বাংলা
বাংলা हिन्दी
 Čeština
 Українська
 Română

The US dollar index remains inside the bearish channel and I expect the price to move lower today and get rejected at the channel resistance. However, I would not bet on the downside as I believe it is limited.
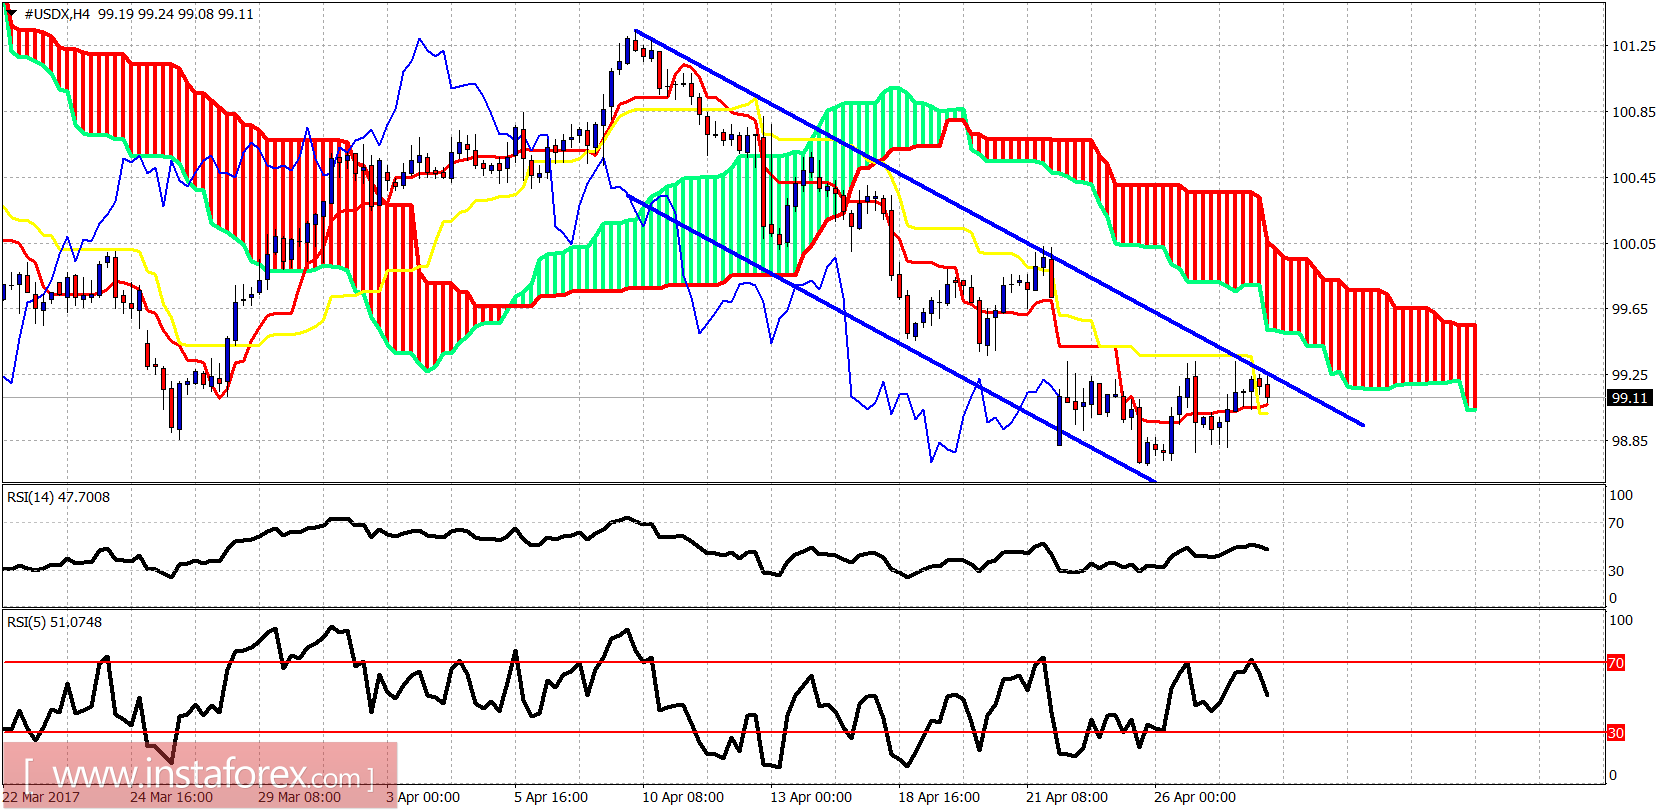
The dollar index is showing rejection signs at the upper channel boundary. A new low is expected to be seen today before the upward reversal. The short-term resistance lies at 99.35. Support is found at 98.80 and the next one at 98.
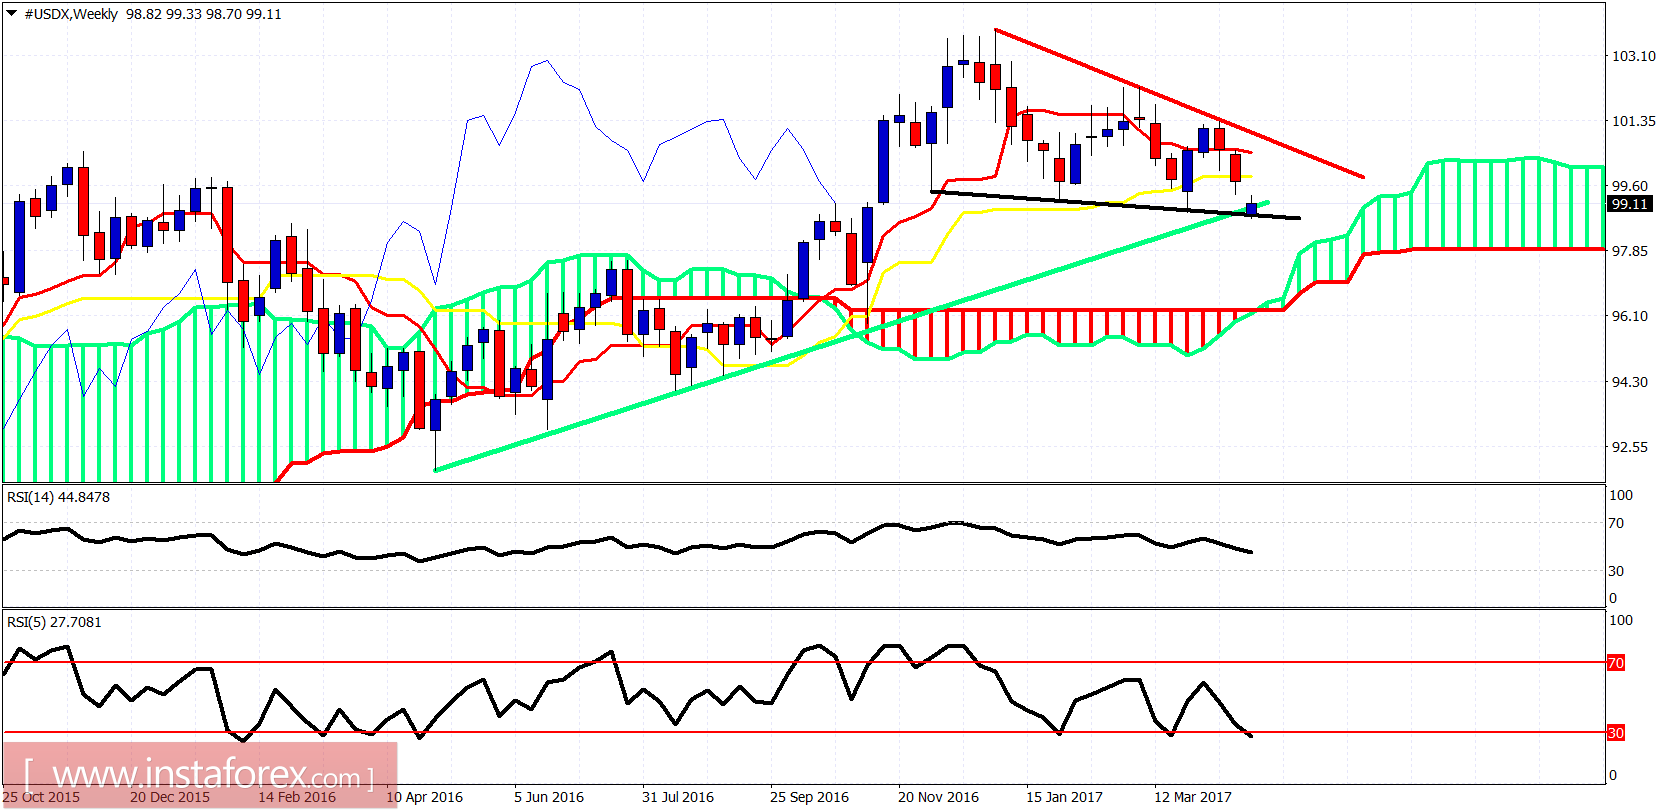
Green line -long-term trend line support
Black line - support trend line
The dollar index remains stuck right on top of the junction of the two important support trend lines for the third day in a row. We may see a false breakout below the trend lines today but overall I believe there are a lot of chances of a bullish reversal. I prefer to wait without opening a position. When I see a reversal signal, I will go long.