 English
  Русский
 Bahasa Indonesia
 Bahasa Malay
 ไทย
ไทย Español
 Deutsch
 Български
 Français
 Tiếng Việt
 中文
中文 বাংলা
বাংলা हिन्दी
 Čeština
 Українська
 Română

The Dollar index made a new low yesterday but still remains inside the important long-term support area. I expect a strong bounce from current levels.
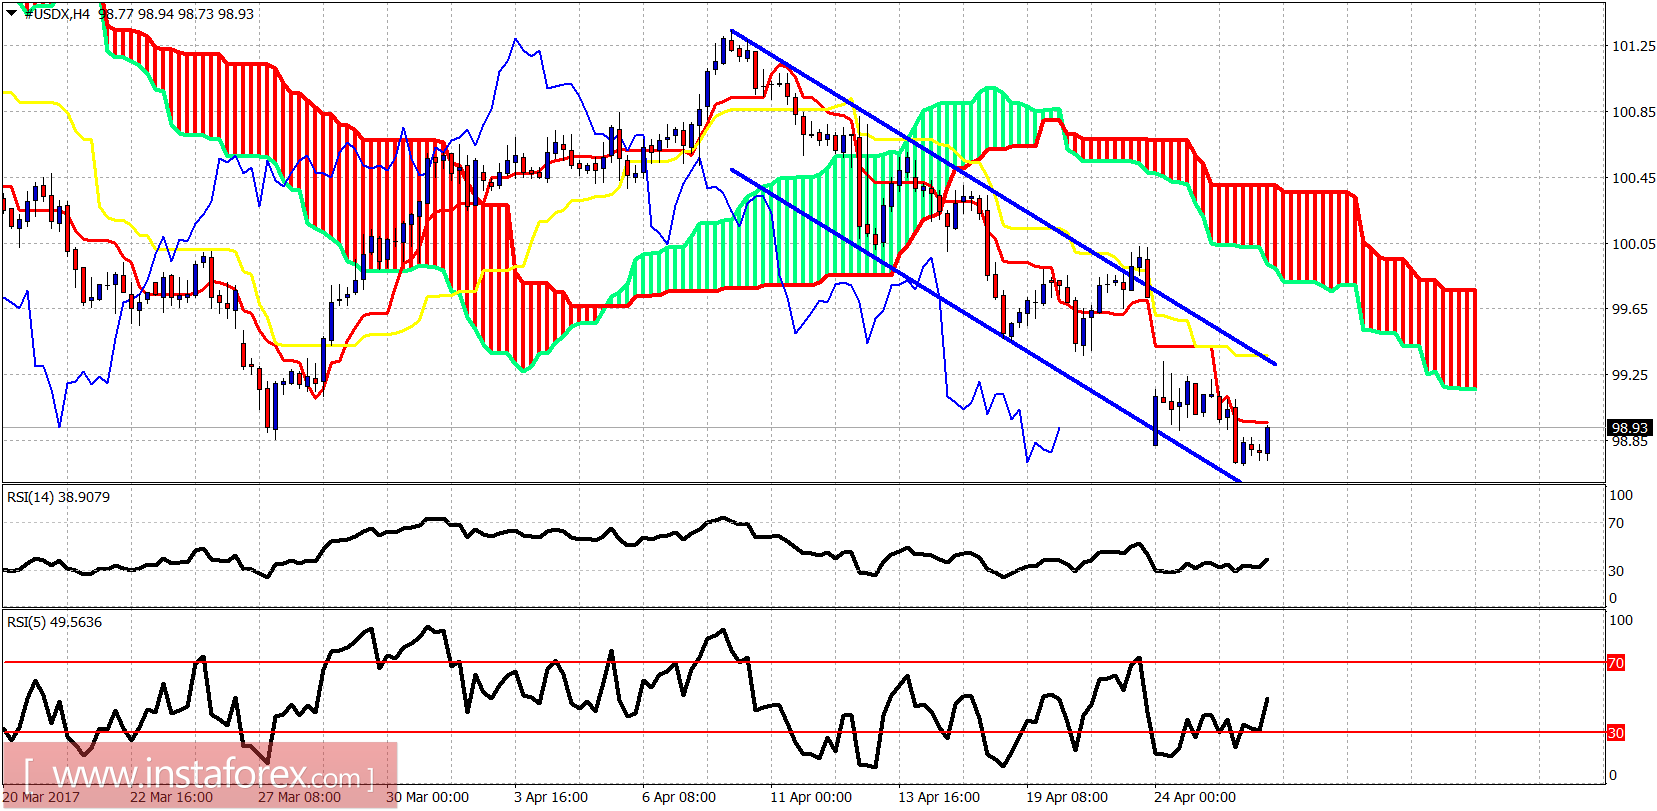
Price remains inside the bearish blue channel but there are bullish divergence signs by the oscillators. Price is now testing the tenkan-sen (red line indicator) resistance now and I expect to at least see a bounce towards the upper channel boundary where the kijun-sen is found. Breaking out of the bearish channel will push price towards at least 99.70 where the Kumo (cloud) is found.
Black line - support
Green line -long-term support trend line
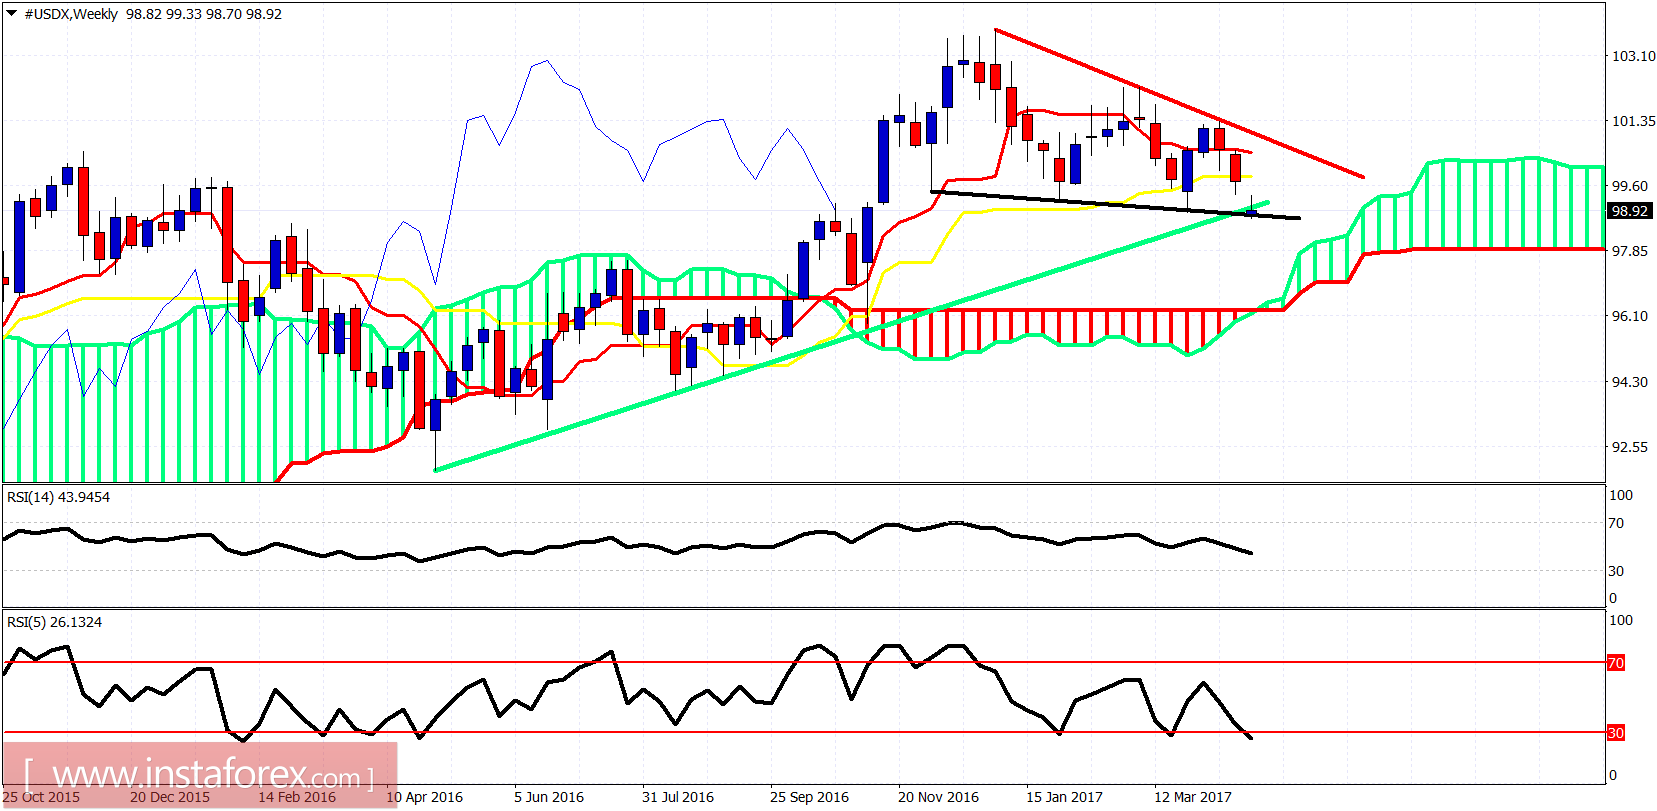
The Dollar index weekly candle is balancing at the edge of the support by the long-term green trend line and the black trend line. Price is above the Kumo but below both the tenkan- and kijun-sen. On a weekly basis, we should expect a strong bounce. If the red trend line is broken, we should expect new highs.