 English
  Русский
 Bahasa Indonesia
 Bahasa Malay
 ไทย
ไทย Español
 Deutsch
 Български
 Français
 Tiếng Việt
 中文
中文 বাংলা
বাংলা हिन्दी
 Čeština
 Українська
 Română

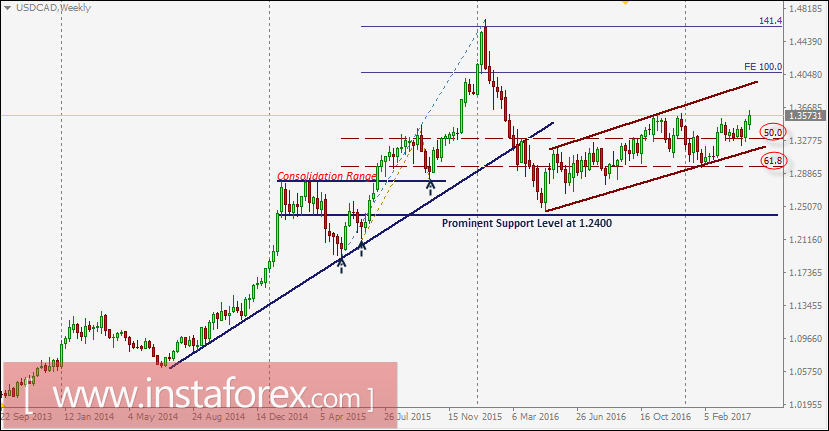
Since April 2016, the USD/CAD pair has been trending upward within the depicted ascending channel.
In December 2016, a bullish breakout above 1.3300 (50% Fibonacci level) was expected to allow a further advance toward 1.3700-1.3750 (the upper limit of the depicted channel).
However, significant bearish rejection was expressed around 1.3580 (recently established top).
During the bearish pullback, the price level of 1.3300 (50% Fibonacci Level) failed to provide enough support to the pair.
This allowed a further bearish movement toward the price level of 1.2970 (61.8% Fibonacci level) where a valid BUY entry was offered in February 2017.
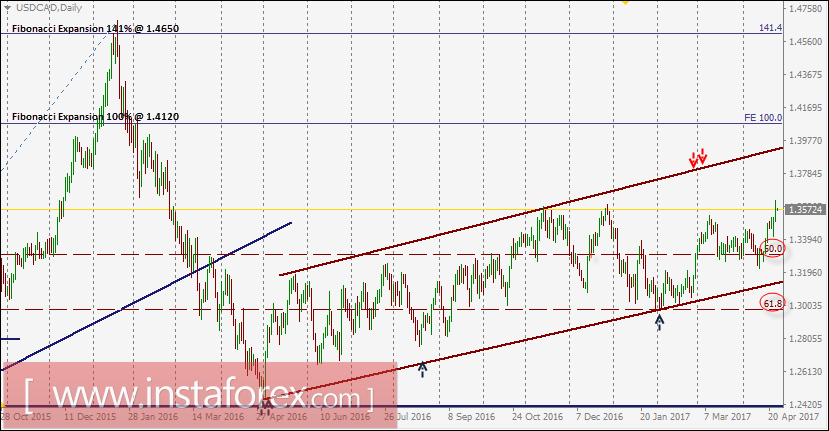
A few weeks ago, the bullish breakout above 1.3300 (50% Fibonacci Level) enhanced a further advance toward 1.3440 and 1.3530.
Expected bullish target would be located around 1.3800 (upper limit of the depicted channel) if the pair maintains upside trading above 1.3300 (50% Fibonacci Level) which stands as a prominent support level.
The next resistance to meet the pair is located around the price level of 1.3580 that should be bypassed to pursue towards next bullish targets.
On the other hand, if the USD/CAD pair moves below 1.3300, it may become trapped again within the depicted consolidation range (1.3300-1.2970).