 English
  Русский
 Bahasa Indonesia
 Bahasa Malay
 ไทย
ไทย Español
 Deutsch
 Български
 Français
 Tiếng Việt
 中文
中文 বাংলা
বাংলা हिन्दी
 Čeština
 Українська
 Română

The pair cannot find a clear path for the short-term, as the narrow range between the 1.2875 and 1.2728 levels remain in place across the board. The 200 SMA at H1 chart is still providing dynamic support, around 1.2728, but overall, there is a sideways structure ongoing. If it manages to break above 1.2875, the bullish bias can receive a nice wave of buyers.
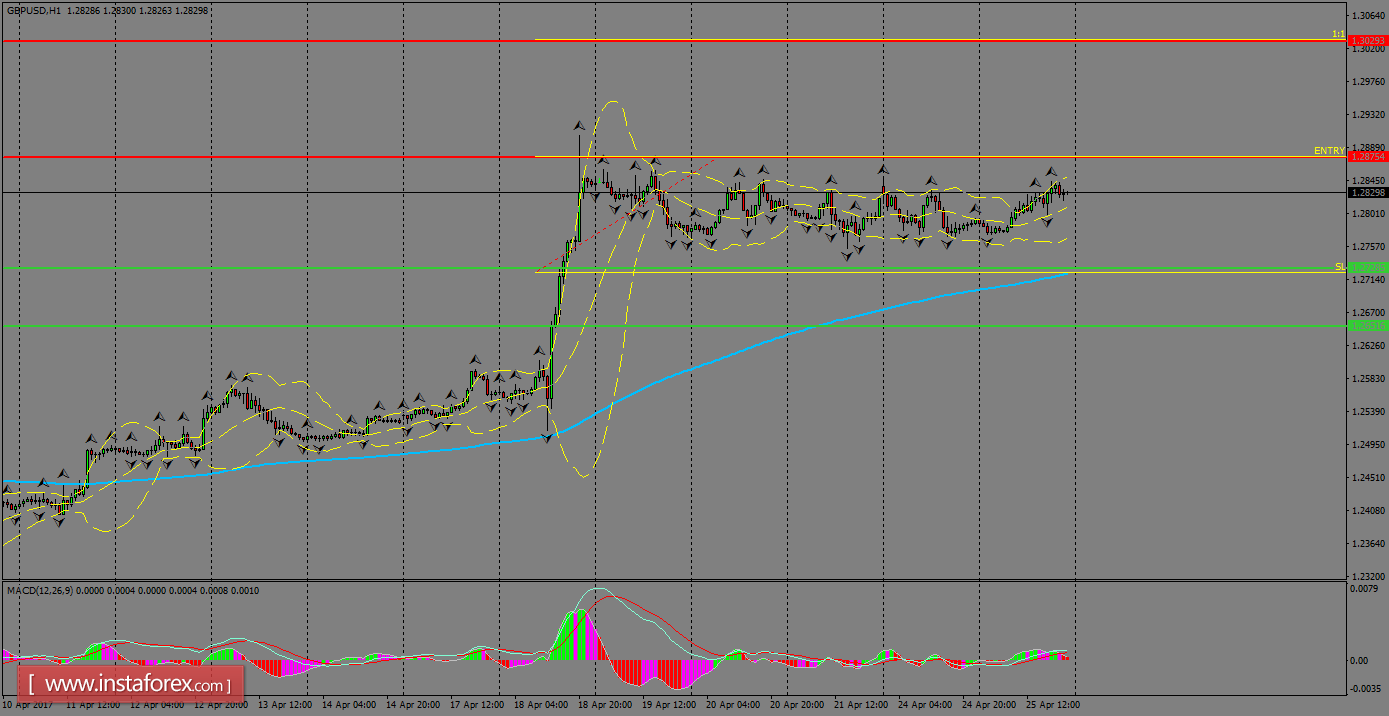
H1 chart's resistance levels: 1.2875 / 1.3029
H1 chart's support levels: 1.2728 / 1.2652
Trading recommendations for today: Based on the H1 chart, buy (long) orders only if the GBP/USD pair breaks a bullish candlestick; the resistance level is at 1.2875, take profit is at 1.3029 and stop loss is at 1.2723.