 English
  Русский
 Bahasa Indonesia
 Bahasa Malay
 ไทย
ไทย Español
 Deutsch
 Български
 Français
 Tiếng Việt
 中文
中文 বাংলা
বাংলা हिन्दी
 Čeština
 Українська
 Română

GBP/USD is still holding its price action above the 1.2800 handle, despite a consolidation that is taking place below the resistance zone of 1.2875. Eventually, the pair might plummet toward 1.2728, where a support area is placed and if such level gives up, then we can expect more weakness to reach the 1.2651 level, which is very close to the 200 SMA at H1 chart.
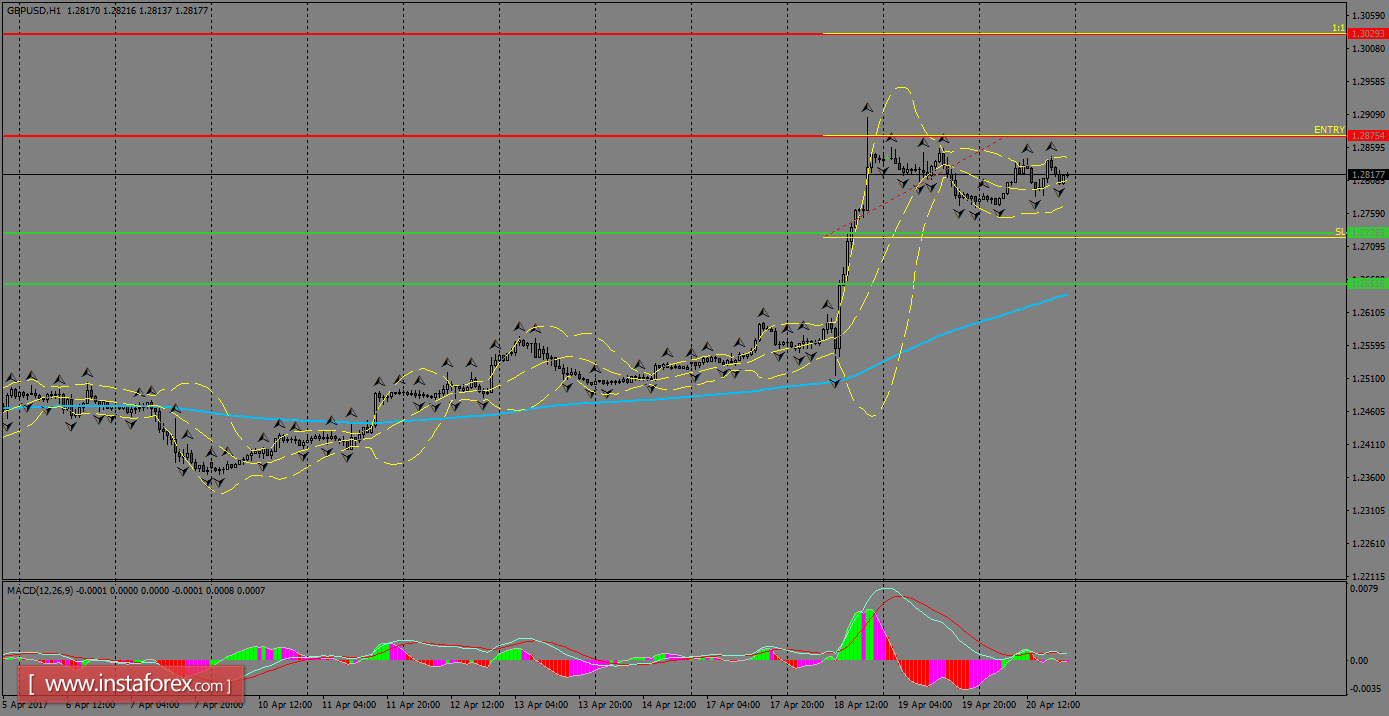
H1 chart's resistance levels: 1.2875 / 1.3029
H1 chart's support levels: 1.2728 / 1.2652
Trading recommendations for today: Based on the H1 chart, buy (long) orders only if the GBP/USD pair breaks a bullish candlestick; the resistance level is at 1.2875, take profit is at 1.3029 and stop loss is at 1.2723.