 English
  Русский
 Bahasa Indonesia
 Bahasa Malay
 ไทย
ไทย Español
 Deutsch
 Български
 Français
 Tiếng Việt
 中文
中文 বাংলা
বাংলা हिन्दी
 Čeština
 Українська
 Română

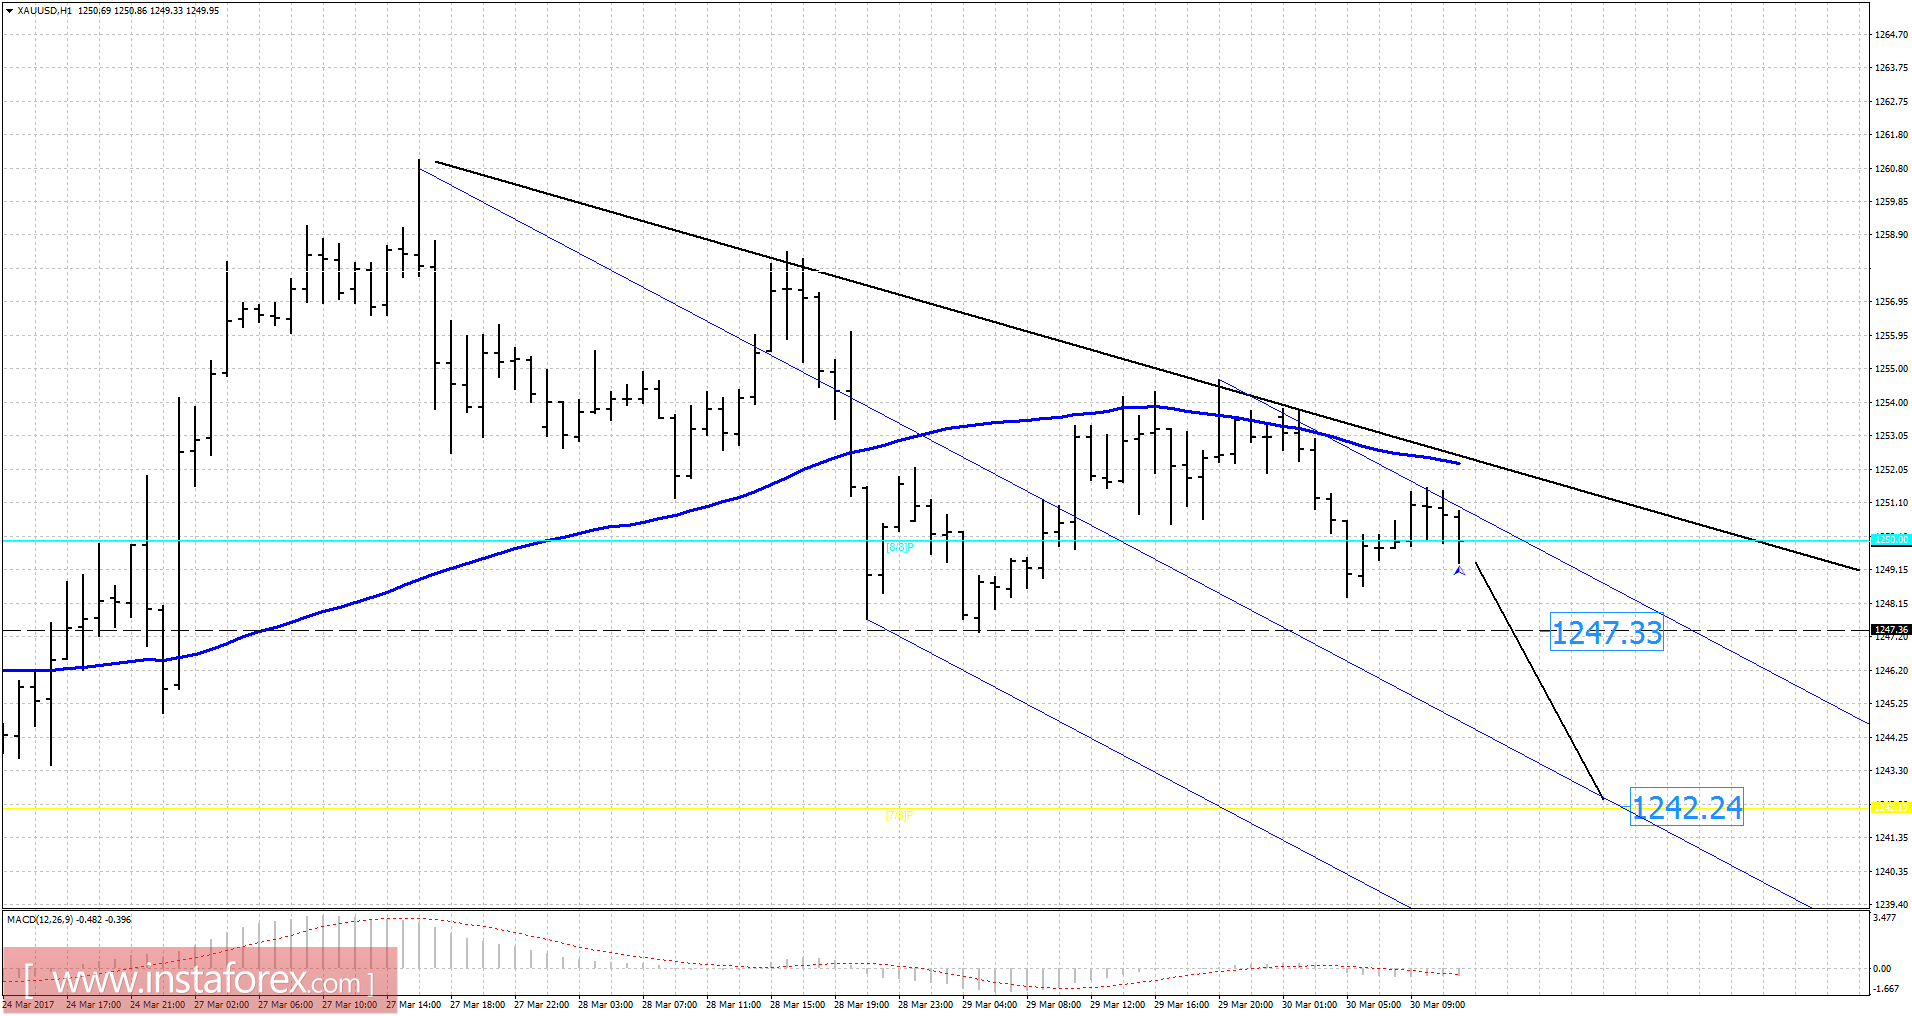
Recently, Gold has been trading sideways at the price of $1,250.00. According to the 1H time frame, I found that еру price is trading inside of the downward channel, which is sign that buying looks risky. The price is also trading below the 60 period simple moving average, which is another sign of weakness. Watch for potential selling opportunities. The downward target is set at the price of $1,242.00.
Resistance levels:
R1: $1,249.80
R2: $1,250.20
R3: $1,250.82
Support levels:
S1: $1,248.50
S2: $1,248.00
S3: $1,247.50
Trading recommendations for today: watch for potential selling opportunities.