 English
  Русский
 Bahasa Indonesia
 Bahasa Malay
 ไทย
ไทย Español
 Deutsch
 Български
 Français
 Tiếng Việt
 中文
中文 বাংলা
বাংলা हिन्दी
 Čeština
 Українська
 Română

The Dollar index bounced towards important short-term resistance at 100. I expect to see at least a small pullback towards 99.60-99.40 before the resumption of the bounce. However this is not necessary. We could very well continue much lower towards 98-97.50.
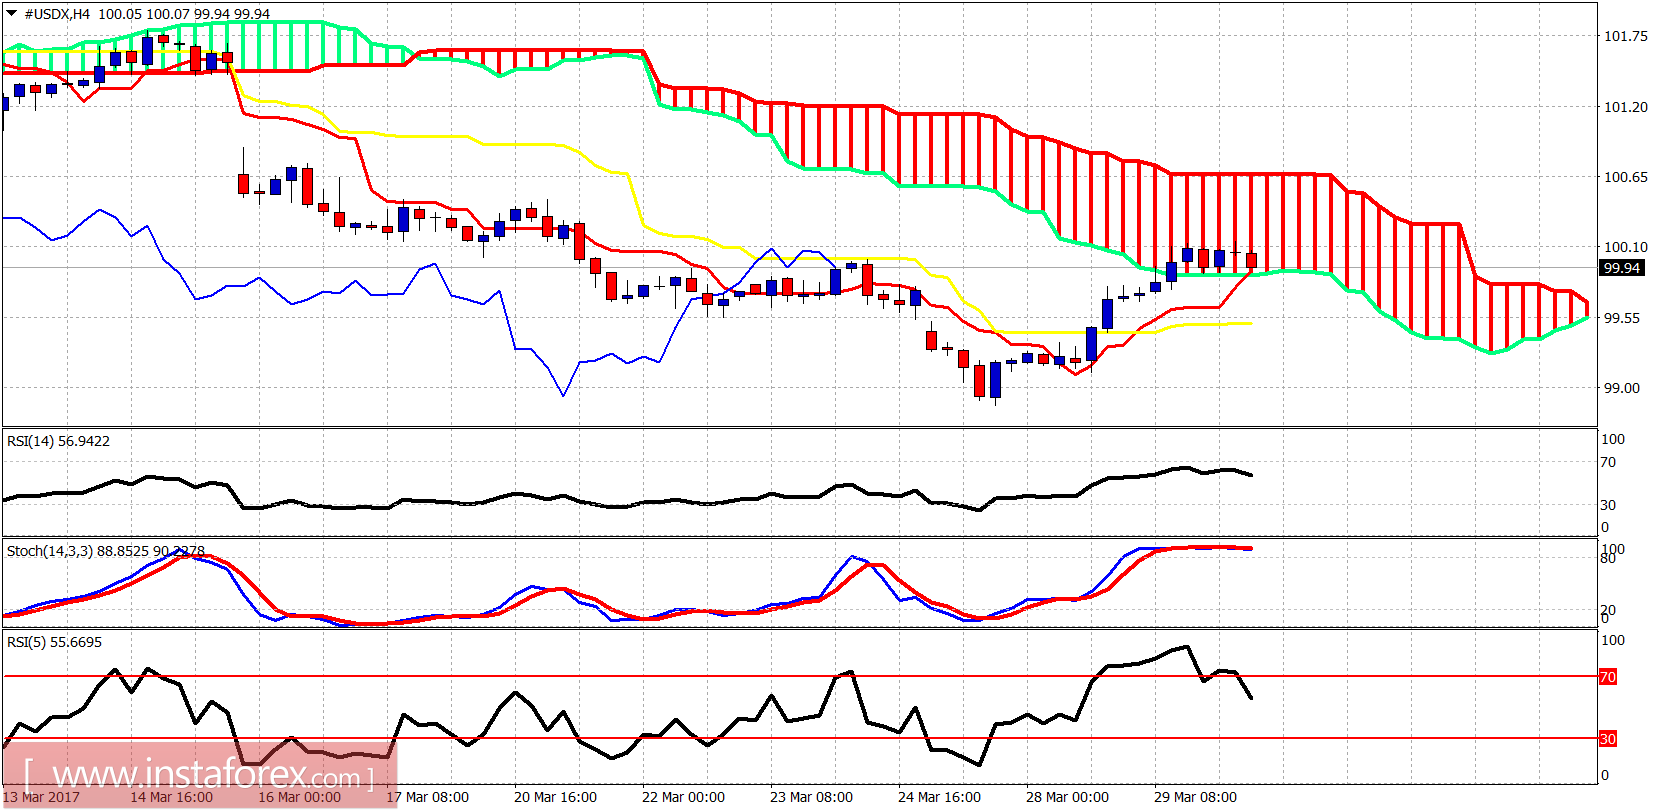
In the 4-hour chart we see that the Ichimoku cloud has provided enough resistance to stop the rise in the Dollar index and with the oscillators overbought and diverging, I will be expecting a decline in the Dollar index at least towards the 4-hour kijun-sen (yellow line indicator) support.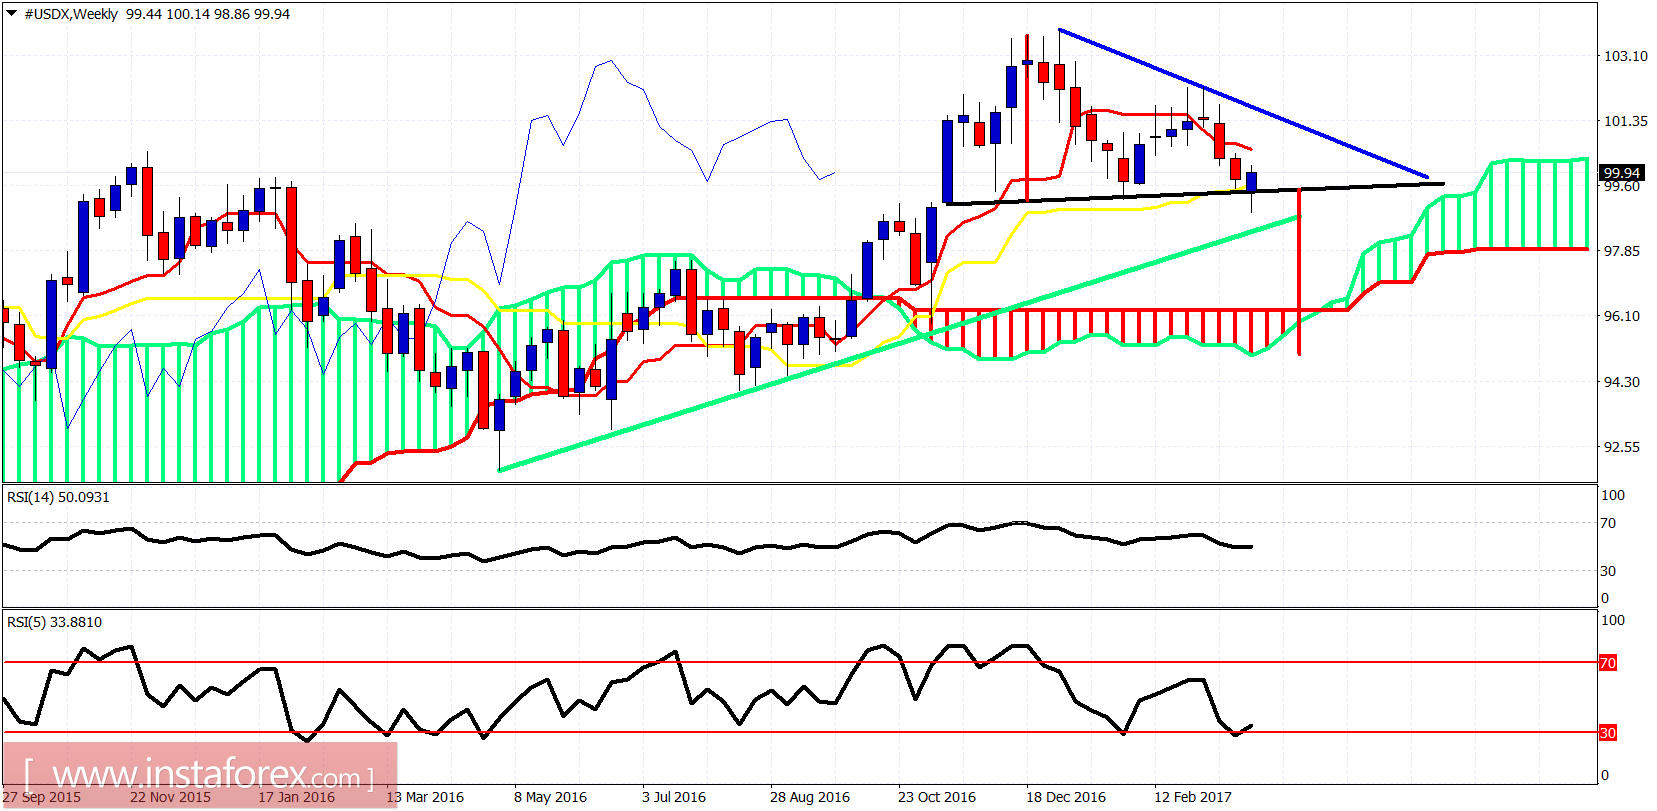
Blue line- resistance trend line
Green line - long-term trend line support
On a weekly basis the Dollar index holds above the neckline support. A break below 99 will confirm the initial break down and the price will be expected to mount a serious challenge at the long-term green trend line support at 98. Breaking below it will open the way for a test of the cloud support.