 English
  Русский
 Bahasa Indonesia
 Bahasa Malay
 ไทย
ไทย Español
 Deutsch
 Български
 Français
 Tiếng Việt
 中文
中文 বাংলা
বাংলা हिन्दी
 Čeština
 Українська
 Română

USDX tested again the 100.00 handle during Wednesday's session, as the index is looking to extend its recovery move above the 200 SMA at H1 chart. However, that moving average is acting as dynamic resistance and it could help to weigh on the index and we could see a decline towards 99.61. If it manages to break below that support zone, then it can reach the 98.98 area.
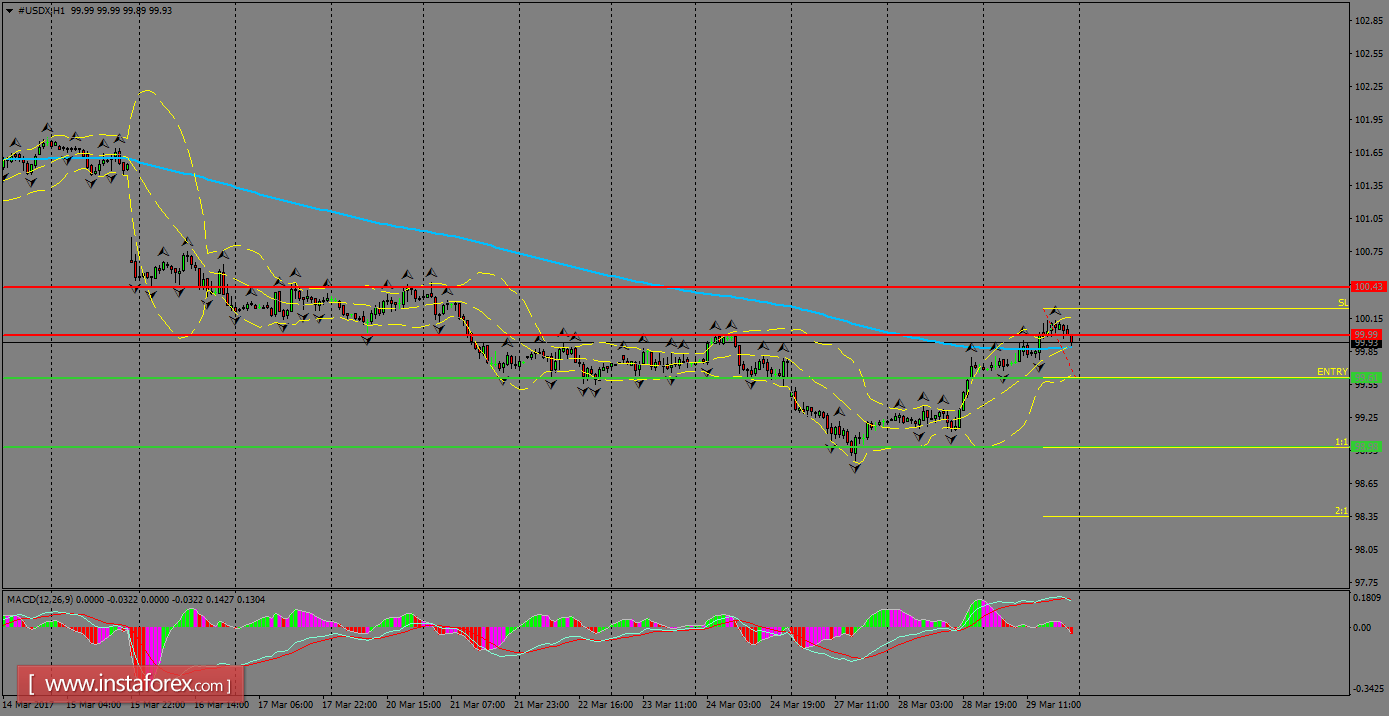
H1 chart's resistance levels: 100.00 / 100.43
H1 chart's support levels: 99.61 / 98.98
Trading recommendations for today: Based on the H1 chart, place sell (short) orders only if the USD Index breaks with a bearish candlestick; the support level is at 99.61, take profit is at 98.98 and stop loss is at 100.23.