 English
  Русский
 Bahasa Indonesia
 Bahasa Malay
 ไทย
ไทย Español
 Deutsch
 Български
 Français
 Tiếng Việt
 中文
中文 বাংলা
বাংলা हिन्दी
 Čeština
 Українська
 Română

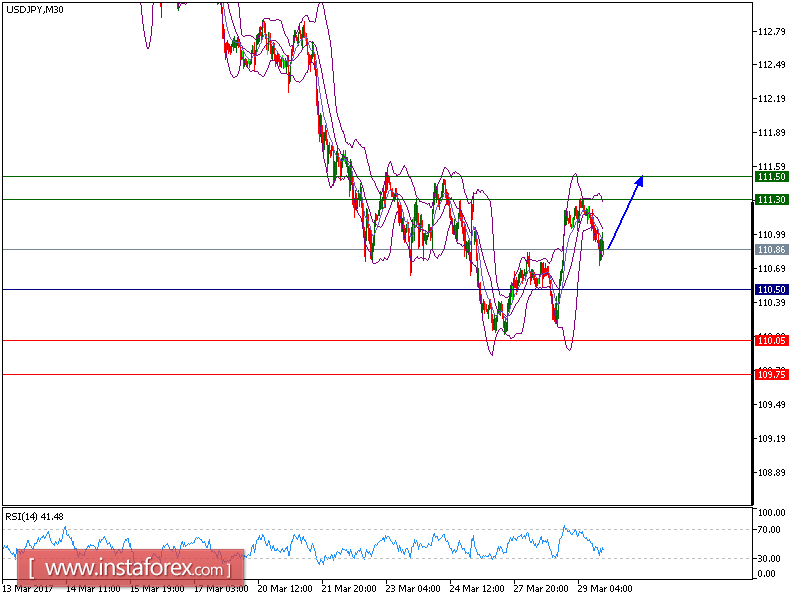
USD/JPY is expected to trade in higher range. The pair is holding on the upside and is trading above its rising 20-period and 50-period moving averages. In addition, a bullish cross between 20-period and 50-period moving averages has been identified which indicates a positive signal. The relative strength index is bullish above its neutrality level at 50 and lacks downward momentum.
To conclude, as long as 110.50 is support, look for a further upside to 111.30 and even to 111.50 in extension.
The pair is trading above its pivot point. It is likely to trade in a wider range as long as it remains above its pivot point. Therefore, long positions are recommended with the first target at 111.30 and the second one at 111.50. In the alternative scenario, short positions are recommended with the first target at 110.05 if the price moves below its pivot points. A break of this target may push the pair further downwards, and one may expect the second target at 109.75. The pivot point is at 110.50.
Resistance levels: 111.30, 111.50, and 111.75
Support levels: 110.05, 109.75, and 109.35