 English
  Русский
 Bahasa Indonesia
 Bahasa Malay
 ไทย
ไทย Español
 Deutsch
 Български
 Français
 Tiếng Việt
 中文
中文 বাংলা
বাংলা हिन्दी
 Čeština
 Українська
 Română

The Dollar index has broken out of the downward sloping wedge. The price is showing reversal signs. I expect the Dollar index to strengthen towards 100.80-101 over the next couple of sessions. Trend is bearish as the price is below the 4-hour cloud.
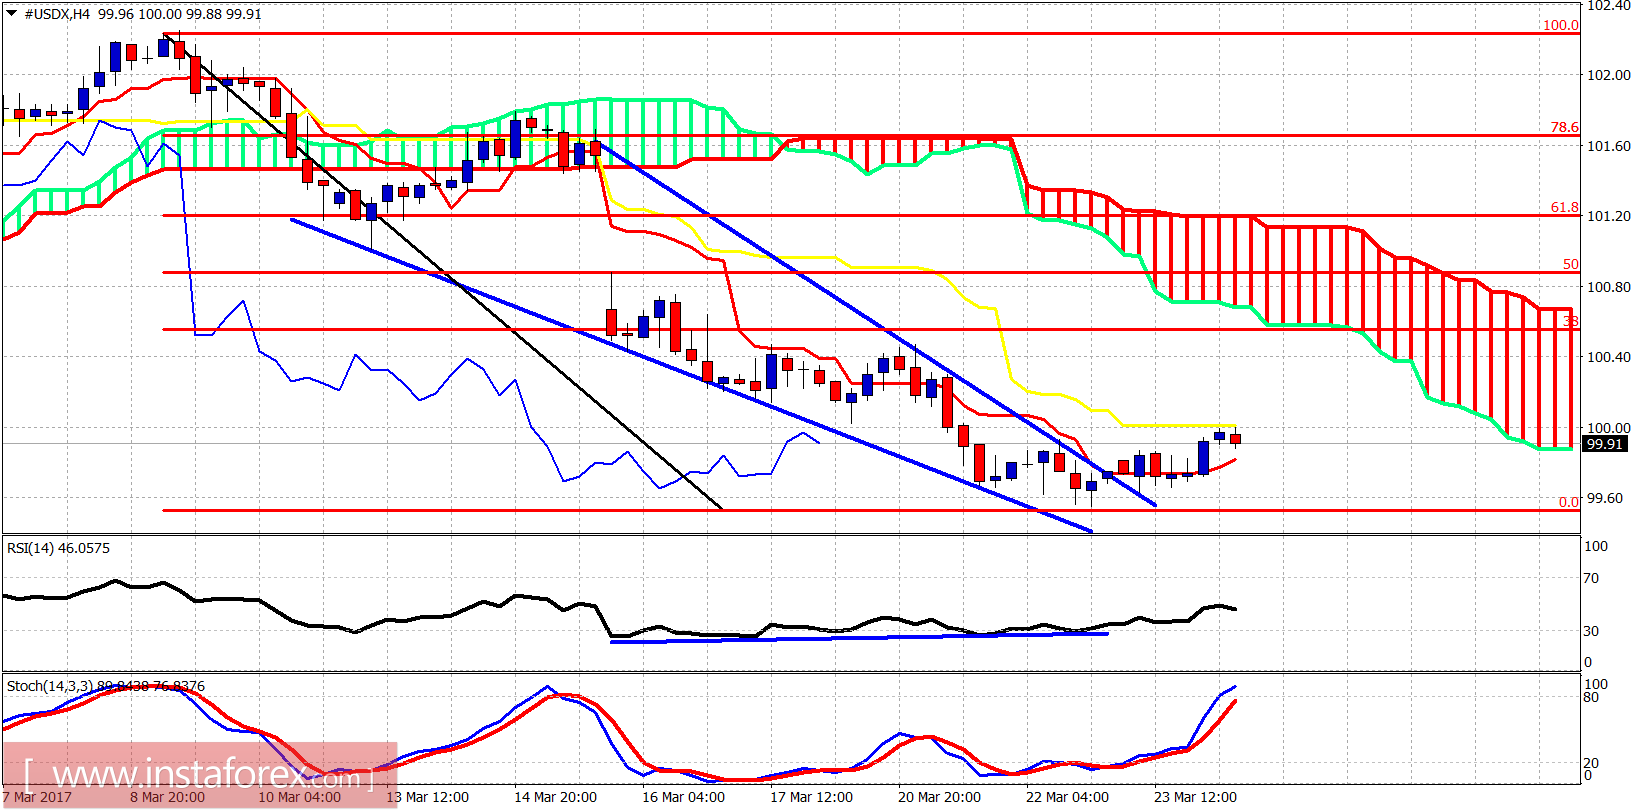
The Dollar index is testing the short-term resistance at 100. I expect a bounce towards cloud resistance at 100.80. Support is at 99.60. The price is very close to long-term support levels so buyers are expected to step in.
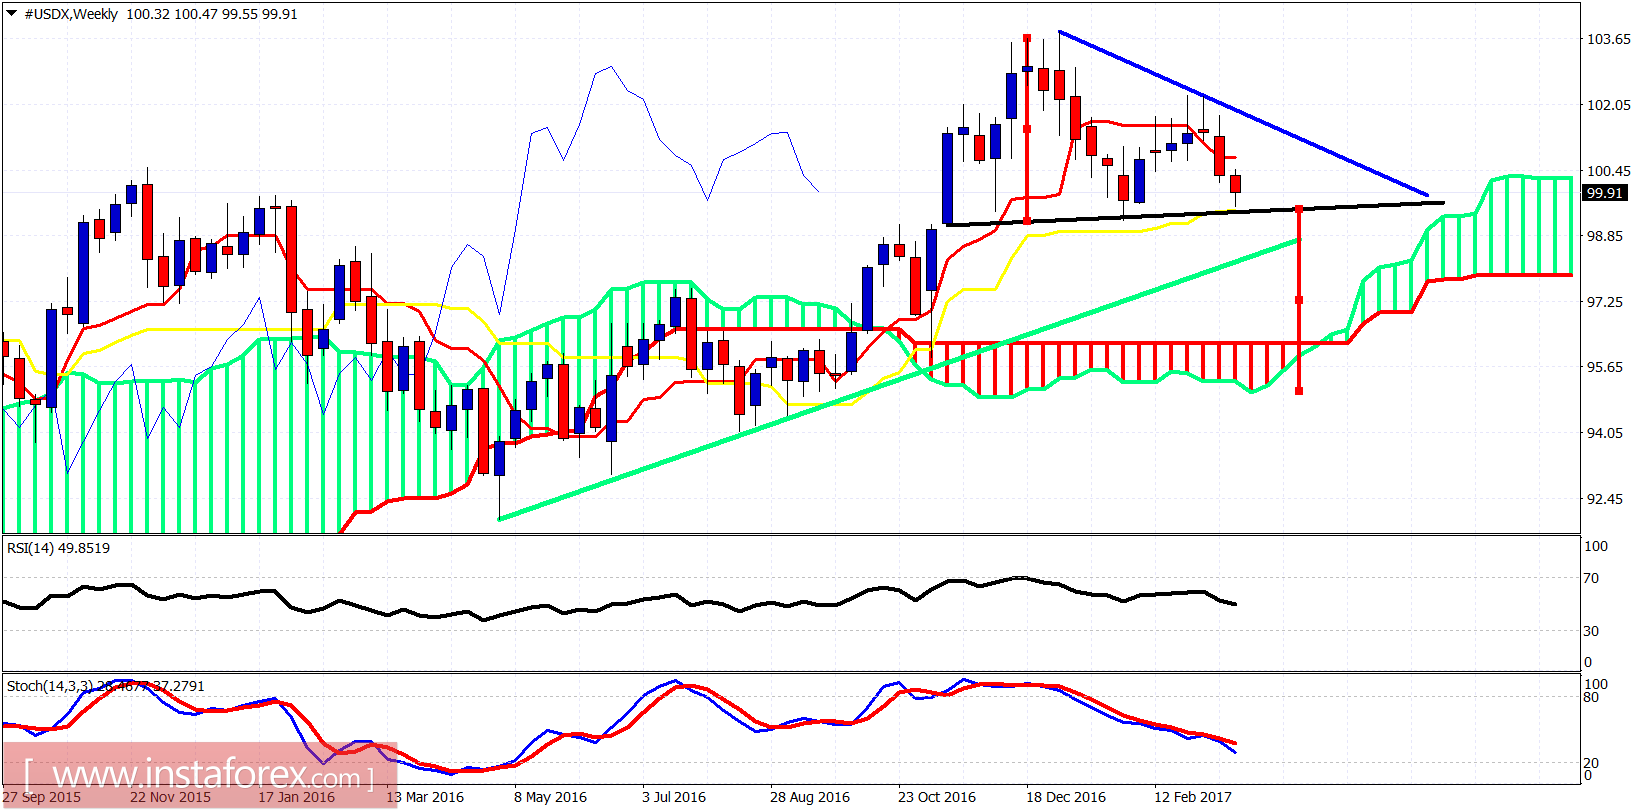
Black line - neckline support
Green line - long-term support trend line
Red lines - price projection target
The Dollar index has reached important weekly support just above 99. If support breaks below the neckline support we should expect a move towards the weekly cloud and even lower. If the price bounces from the current levels, it should find resistance at the blue trend line at 101.80. As long as the price is below the blue trend line, the chances are in favor of a bearish breakdown. This will be confirmed on a break below the necklines at 99.25.