 English
  Русский
 Bahasa Indonesia
 Bahasa Malay
 ไทย
ไทย Español
 Deutsch
 Български
 Français
 Tiếng Việt
 中文
中文 বাংলা
বাংলা हिन्दी
 Čeština
 Українська
 Română

GBP/USD is making efforts to break above 1.2409, as the bulls are keeping the pair alive above the 200 SMA on H1 chart. If we witness a move to invalidate that resistance, then we could expect further rallies to test the 1.2512 level. However, the pair may start to pull back in order to test the 1.2292 level. MACD indicator is supporting the bearish scenario.
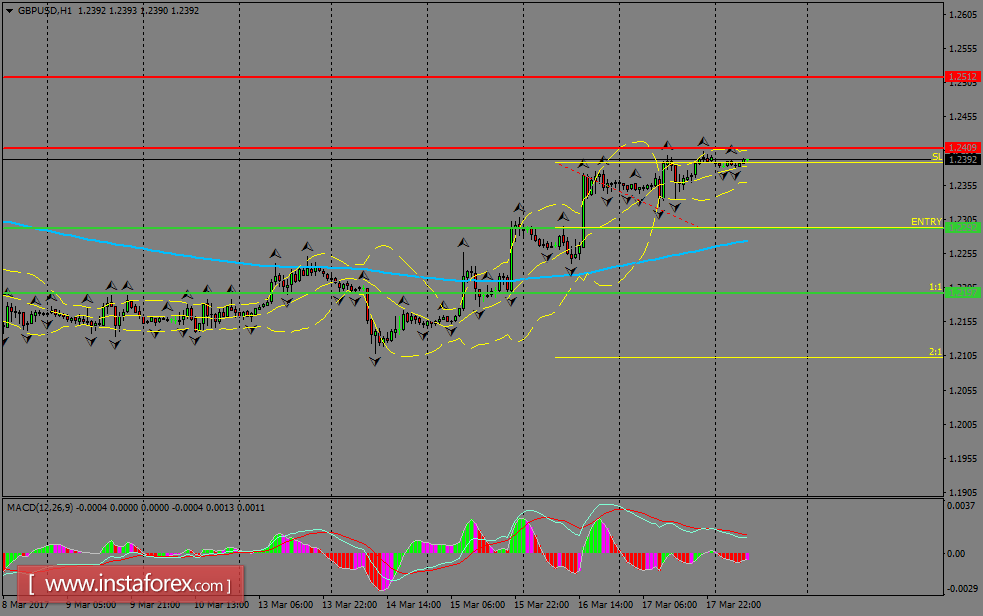
H1 chart's resistance levels: 1.2409 / 1.2512
H1 chart's support levels: 1.2292 / 1.2197
Trading recommendations for today: Based on the H1 chart, sell (short) orders only if the GBP/USD pair breaks a bearish candlestick; the support level is at 1.2292, take profit is at 1.2197 and stop loss is at 1.2387.