 English
  Русский
 Bahasa Indonesia
 Bahasa Malay
 ไทย
ไทย Español
 Deutsch
 Български
 Français
 Tiếng Việt
 中文
中文 বাংলা
বাংলা हिन्दी
 Čeština
 Українська
 Română

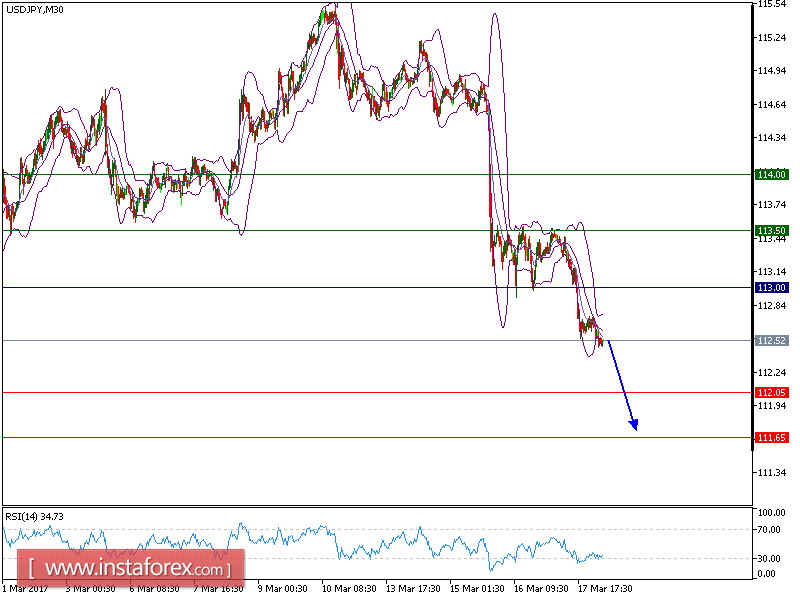
USD/JPY is expected to prevail its downside movement. The pair is trading below its declining 20-period and 50-period moving averages, which play resistance roles and maintain the downside bias, and is consolidating on the downside. The relative strength index is below its neutrality level at 50 and lacks upward momentum.
As long as 113.00 holds on the upside, look for a further drop toward 112.05 and even 111.65 in extension.
The pair is trading below its pivot point. It is likely to trade in a lower range as long as it remains below the pivot point. Short positions are recommended with the first target at 112.05. A break below this target will move the pair further downwards to 111.65. The pivot point stands at 113.00. If the price moves in the opposite direction and bounces back from the support level, it will move above its pivot point. It is likely to move further to the upside. According to that scenario, long positions are recommended with the first target at 113.50 and the second one at 114.00.
Resistance levels: 113.50, 114.00, and 114.45
Support levels: 112.05, 111.65, and 111.25