 English
  Русский
 Bahasa Indonesia
 Bahasa Malay
 ไทย
ไทย Español
 Deutsch
 Български
 Français
 Tiếng Việt
 中文
中文 বাংলা
বাংলা हिन्दी
 Čeština
 Українська
 Română

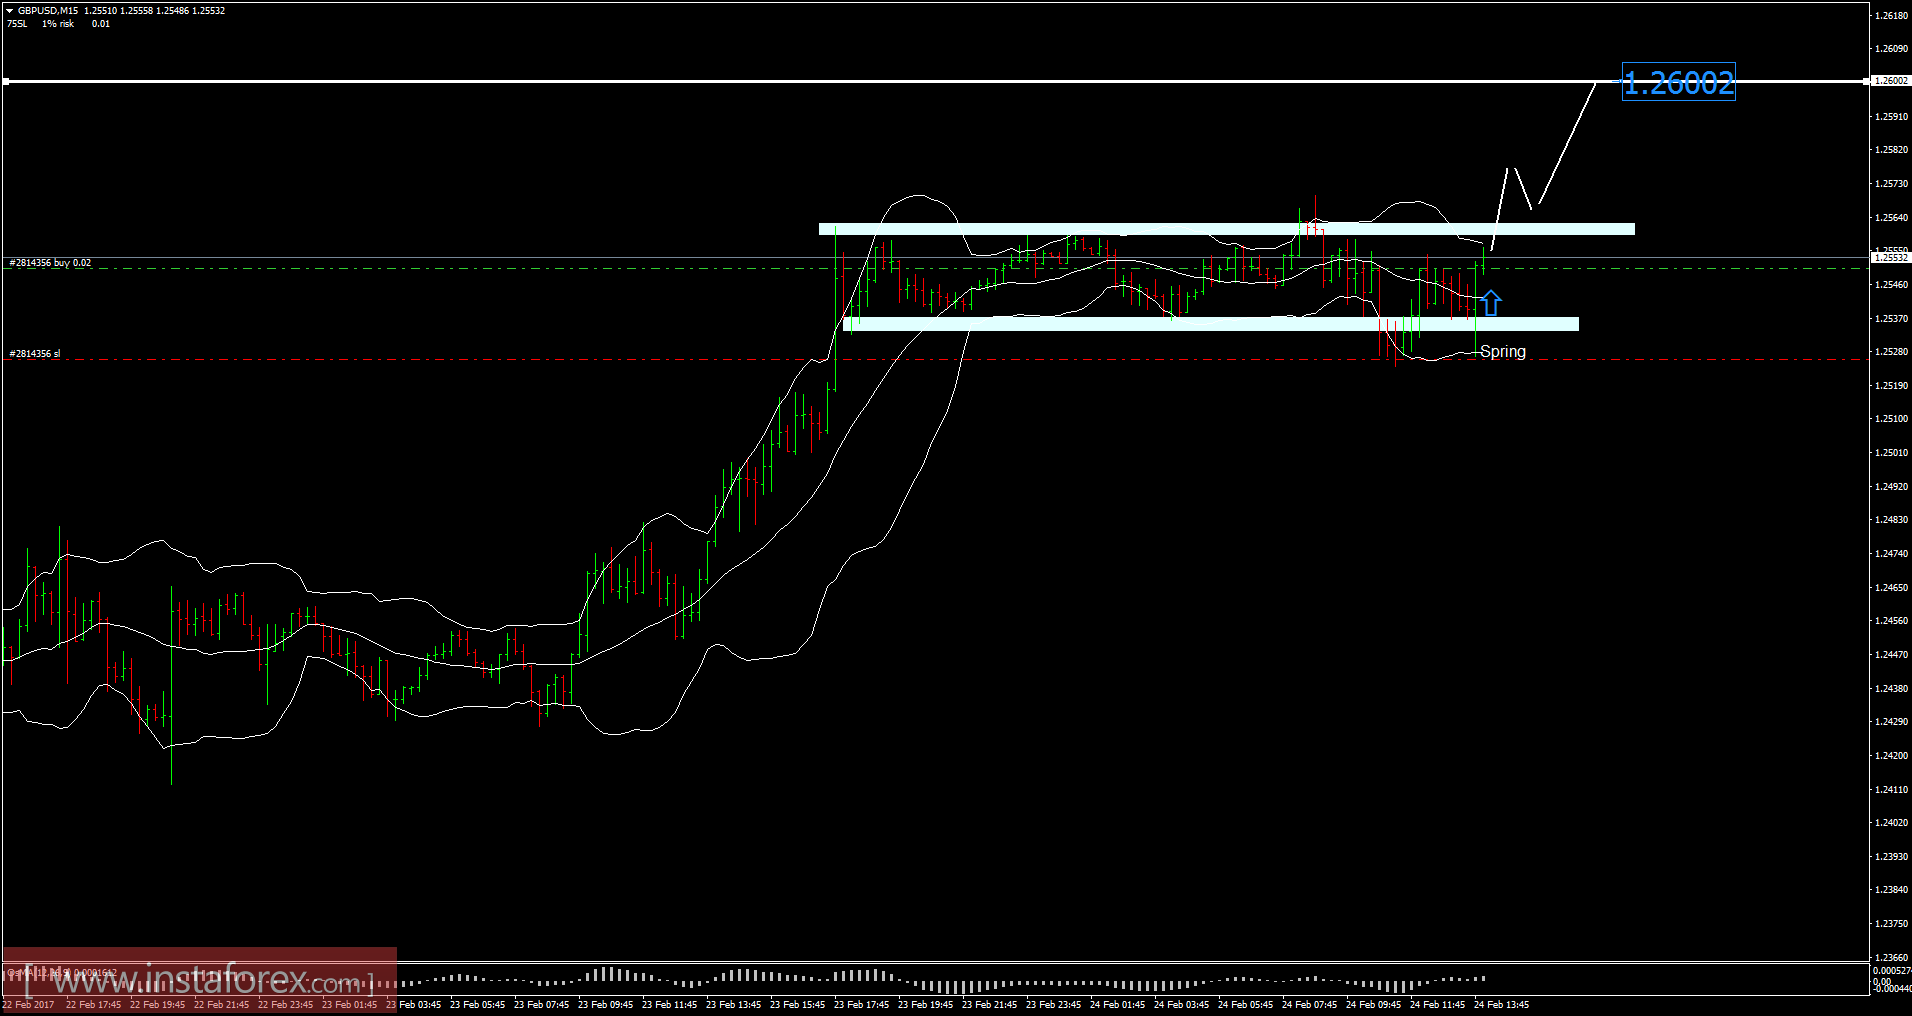
Recently, the GBP/USD has been trading sideways at the price of 1.2550. According to the 15M time frame, I found potetnial re-accumulation in progress. GBP/USD is range-trading between the prices of 1.2523 (support) and 1.2570. I found a spring bar (shakeout bar), which is a sign that we may see a higher price on GBP/USD. Anyway, final confirmation will be if the price breaks the resistance at 1.2570. Upward targets are set at the prices of 1.2600,1.2650, and 1.2700.
Resistance levels:
R1: 1.2560
R2: 1.2597
R3: 1.2650
Support levels:
S1: 1.2465
S2: 1.2430
S3: 1.2380
Trading recommendations for today: watch for potential buying opportunities.