English
  Русский
 Bahasa Indonesia
 Bahasa Malay
 ไทย
ไทย Español
 Deutsch
 Български
 Français
 Tiếng Việt
 中文
中文 বাংলা
বাংলা हिन्दी
 Čeština
 Українська
 Română

Overview:
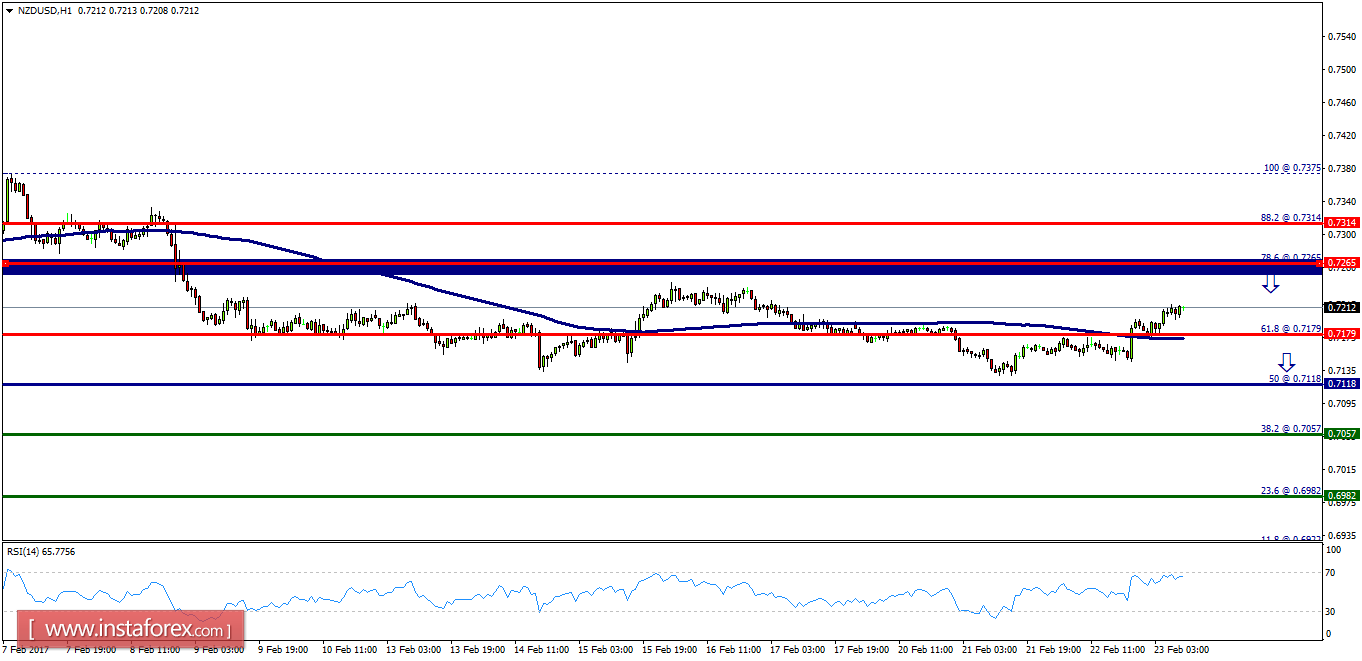
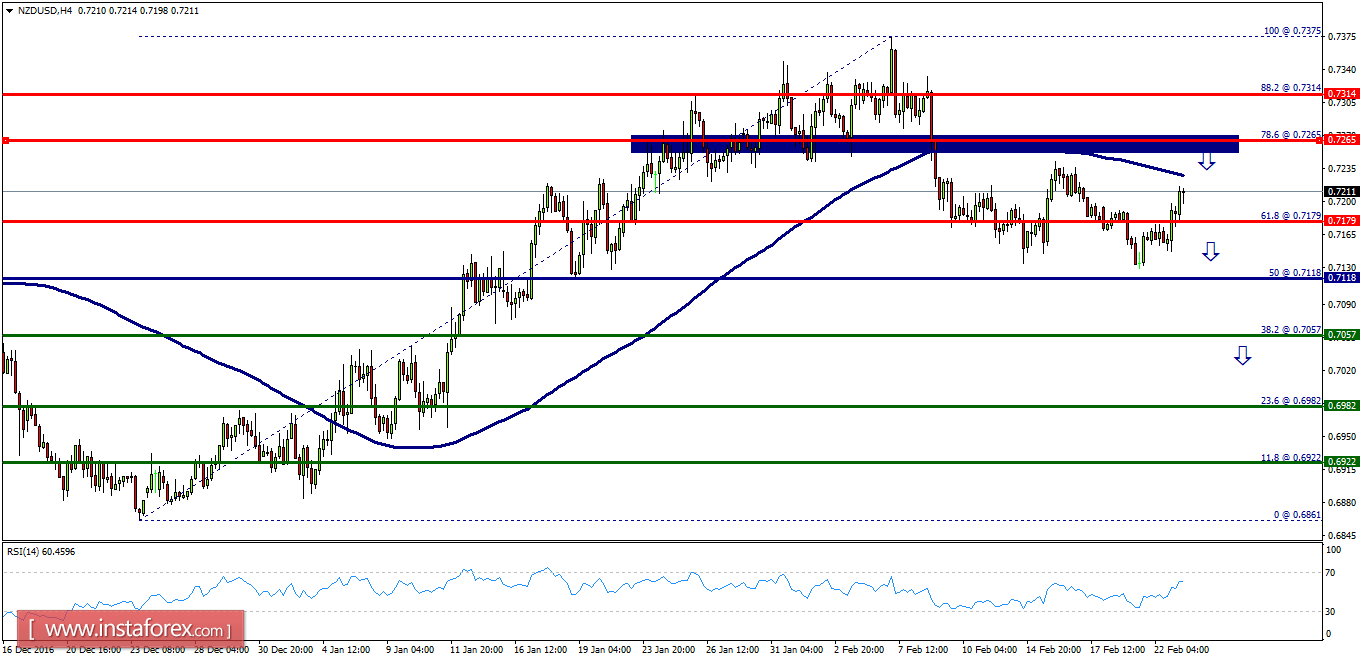
- The NZD/USD pair continues to move downwards from the level of 0.7220. Now the price is seen at 0.7215.
- Today, the first resistance level is seen at 0.7220 followed by 0.7265 (major resistance), while daily support 1 is found at 0.7118.
- Besides, the level of 0.7118 represents a daily pivot point for that it is acting as a key level today.
- Amid the previous events, the pair is still in a downtrend, because the NZD/USD pair is trading in a bearish trend from the new resistance line of 0.7265 towards the first support level at 0.7118 in order to test it.
- If the pair succeeds to pass through the level of 0.7118, the market will indicate a bearish opportunity below the level of 0.7118 with the second target of 0.7057.
- However, if a breakout happens at the resistance level of 0.7265, then this scenario may be invalidated.