 English
  Русский
 Bahasa Indonesia
 Bahasa Malay
 ไทย
ไทย Español
 Deutsch
 Български
 Français
 Tiếng Việt
 中文
中文 বাংলা
বাংলা हिन्दी
 Čeština
 Українська
 Română

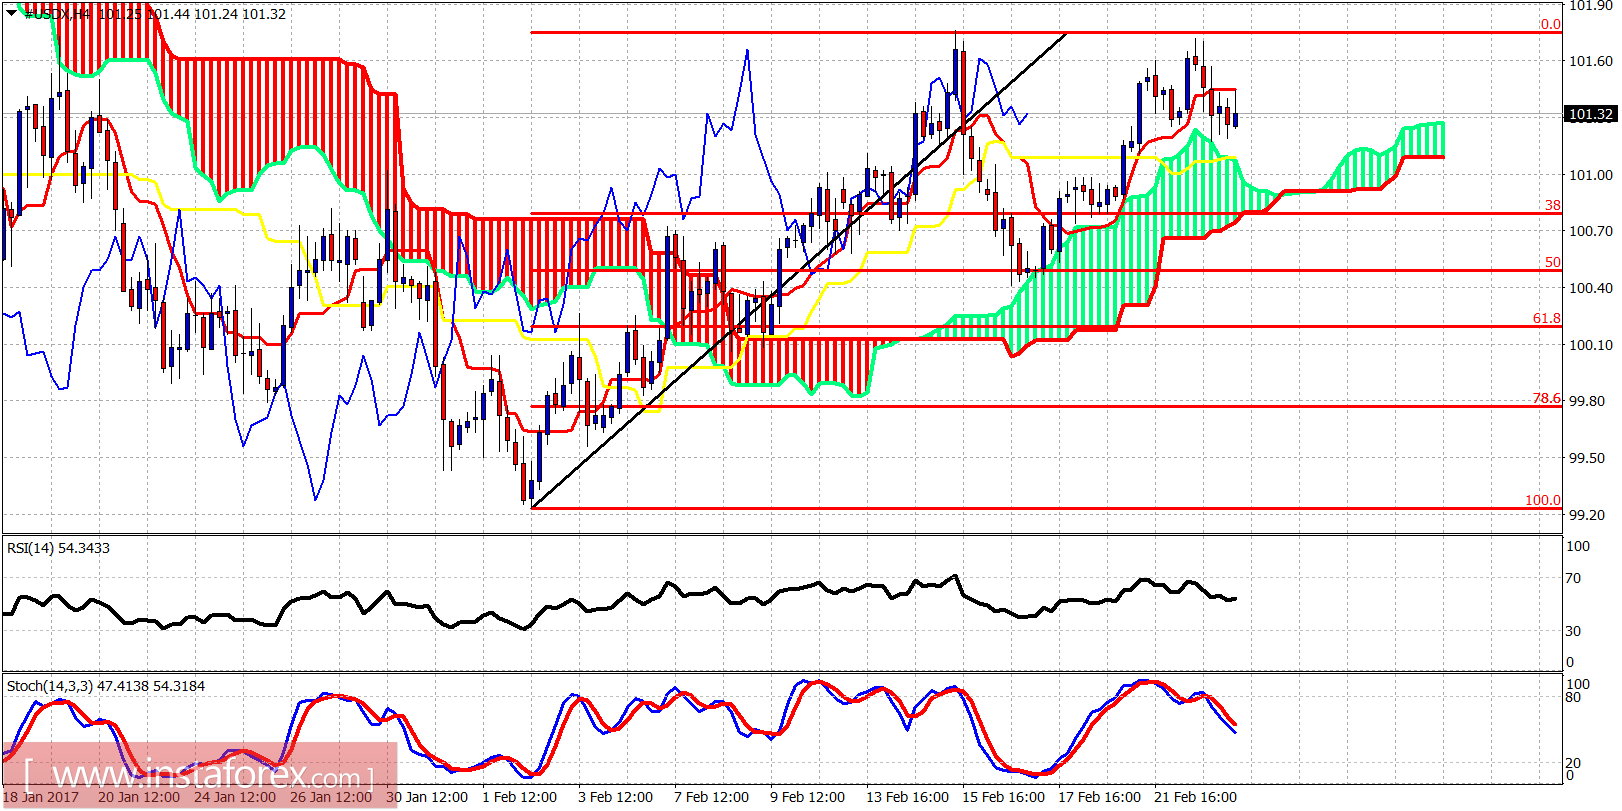
The Dollar index reached important resistance yesterday at 101.70 but got rejected and pulled back towards 101.40 short-term support. The bearish scenario of the Head-and-Shoulders pattern is still applicable but only a break below 99.25 will confirm it.
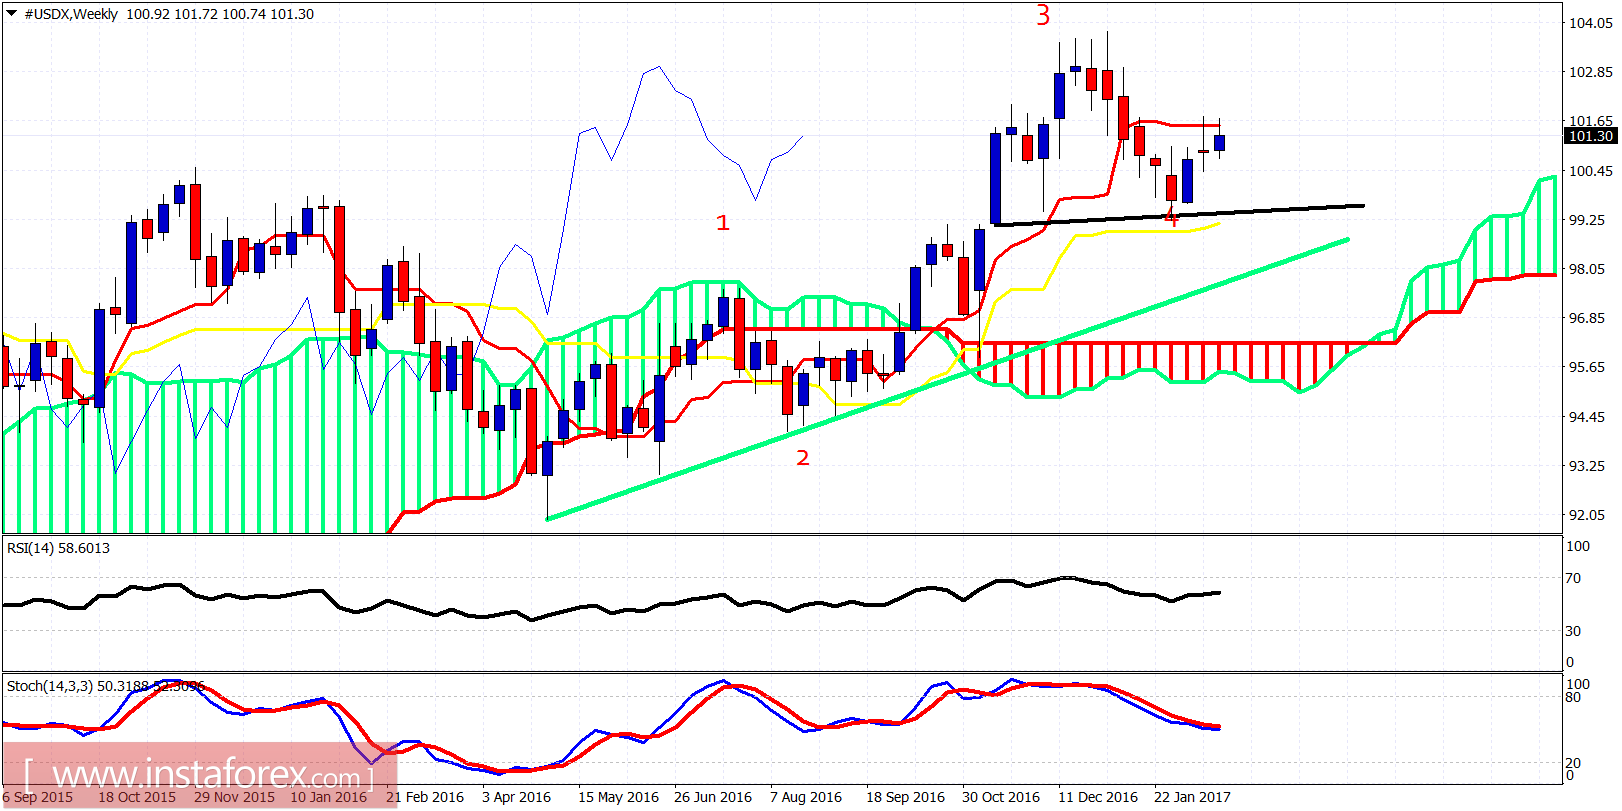
Green line - long-term trend line support
The Dollar index is trading between the kijun- and tenkan-sen indicators (yellow and red line indicators). On a weekly basis, trend remains bullish but a possible double top at 101.80 and rejection by the tenkan-sen will be bad news for bulls. Don't forget that we could be forming the right hand shoulder in the bearish Head-and-Shoulders pattern.