 English
  Русский
 Bahasa Indonesia
 Bahasa Malay
 ไทย
ไทย Español
 Deutsch
 Български
 Français
 Tiếng Việt
 中文
中文 বাংলা
বাংলা हिन्दी
 Čeština
 Українська
 Română

Gold price remains supported. Despite the push lower yesterday towards $1,230, Gold buyers stepped in and pushed price back above $1,237. Trend remains bullish. Soon we should see a break out above $1,245 and a move towards $1,280-$1,320.
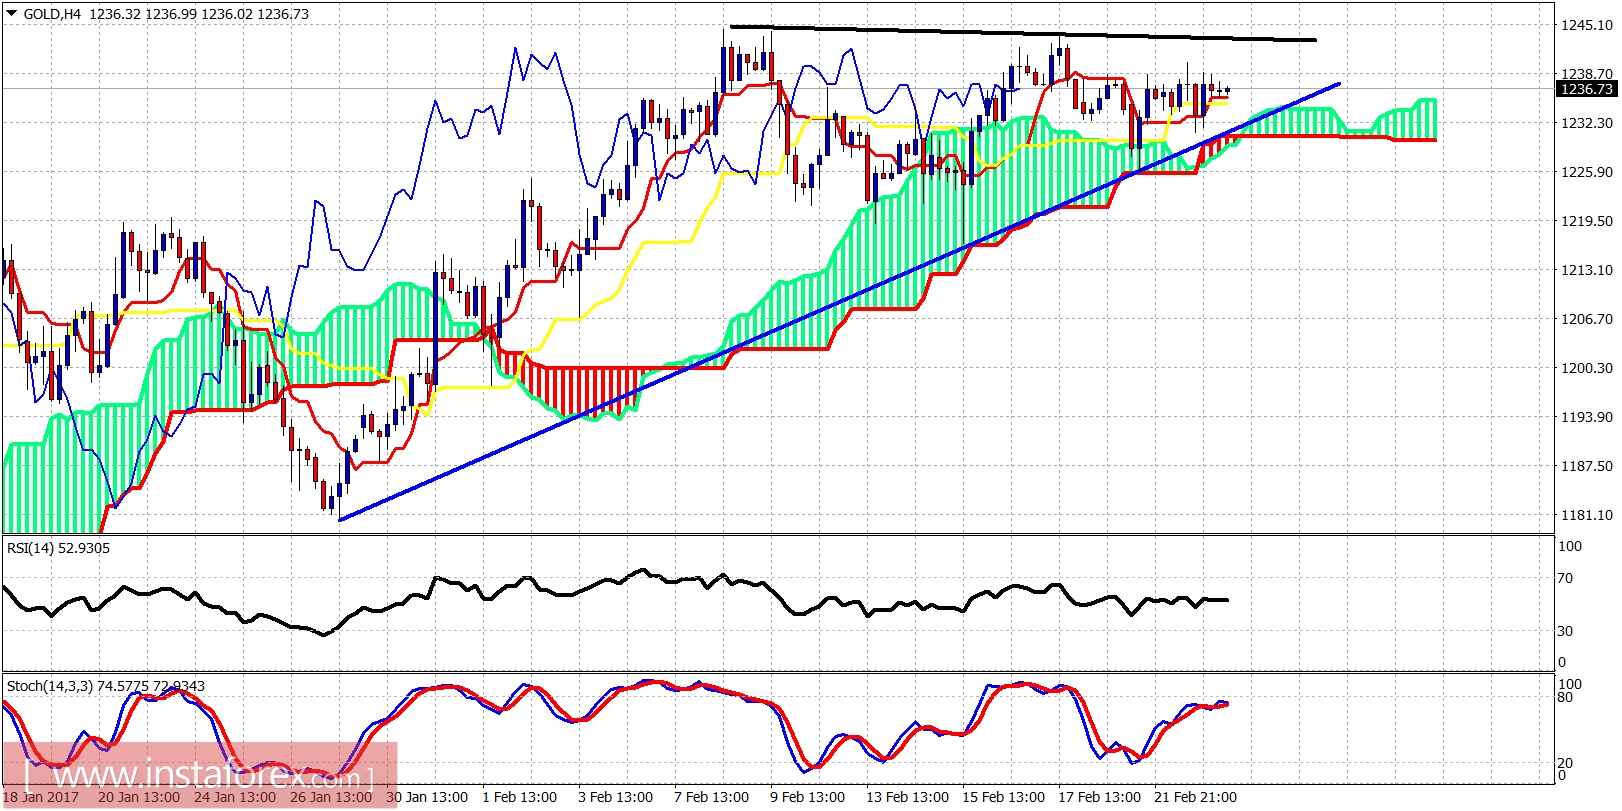
Blue line - support
Black line - resistance
Gold price continues to trade above the Ichimoku cloud. Price also reamains above important support trend line. Every time price made a dip towards $1,220 or below $1,230, buyers stepped in and pushed Gold higher above $1,235 each time. However, the confirmation of the bullish trend will come with the break above $1,245. Breaking it will be a good bullish signal.
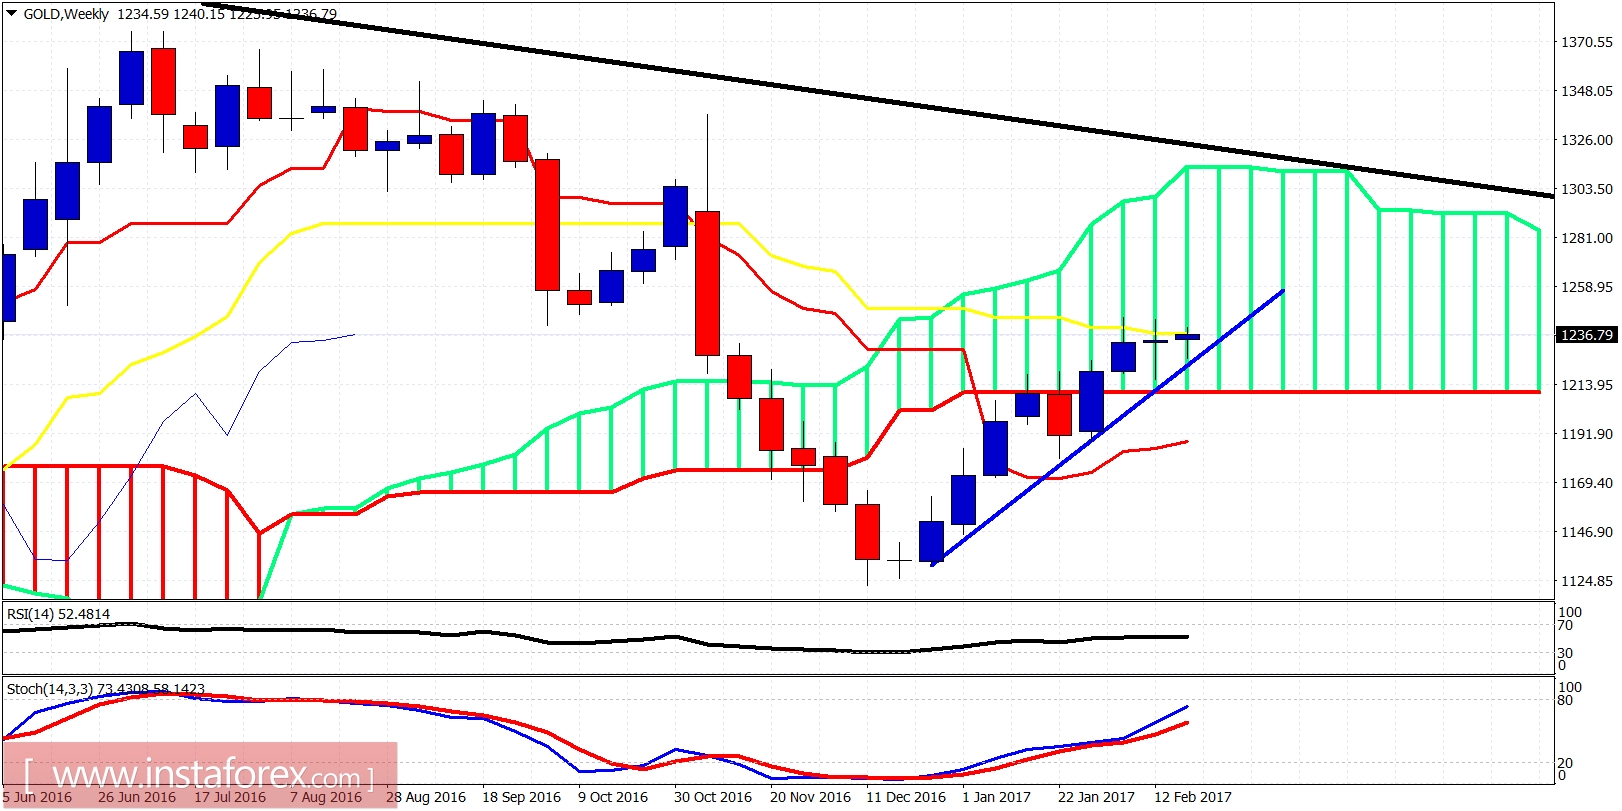
Why is Gold price stuck here at $1,240-45? Because here we find the weekly kijun-sen (yellow line indicator) resistance. It is not easy to break it. But if and when it breaks upwards, we will be heading towards the upper cloud boundary around $1,280-$1,300.