 English
  Русский
 Bahasa Indonesia
 Bahasa Malay
 ไทย
ไทย Español
 Deutsch
 Български
 Français
 Tiếng Việt
 中文
中文 বাংলা
বাংলা हिन्दी
 Čeština
 Українська
 Română

GBP/USD remains supported in the short term above the 1.2400 handle, but we're still watching a consolidation which is unfolding below the 200 SMA on H1 chart. If the pair manages to break above 1.2480, then we can expect a further rally to test the 1.2561 zone. In the other scenario, if the support zone of 1.2414 gives up, then a decline to test the 1.2360 level is likely to happen.
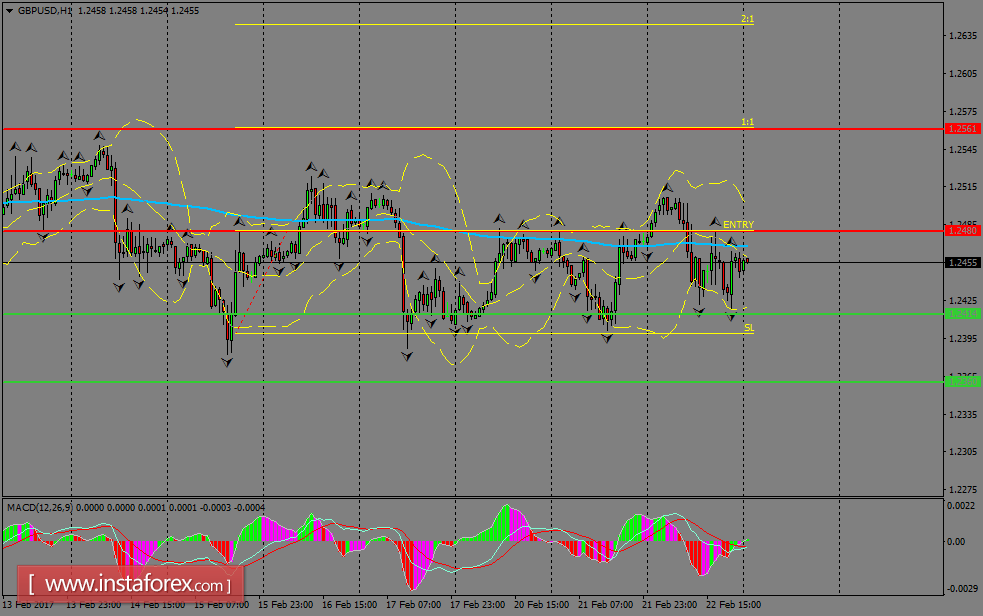
H1 chart's resistance levels: 1.2480 / 1.2561
H1 chart's support levels: 1.2414 / 1.2360
Trading recommendations for today: Based on the H1 chart, buy (long) orders only if the GBP/USD pair breaks a bullish candlestick; the resistance level is at 1.2480, take profit is at 1.2561 and stop loss is at 1.2398.