 English
  Русский
 Bahasa Indonesia
 Bahasa Malay
 ไทย
ไทย Español
 Deutsch
 Български
 Français
 Tiếng Việt
 中文
中文 বাংলা
বাংলা हिन्दी
 Čeština
 Українська
 Română

The Dollar index continues to move higher as the price is making higher highs and higher lows. The price has reached important short-term resistance and previous highs. A pullback towards the 101-100.50 level is expected before the resumption of the uptrend towards 103.
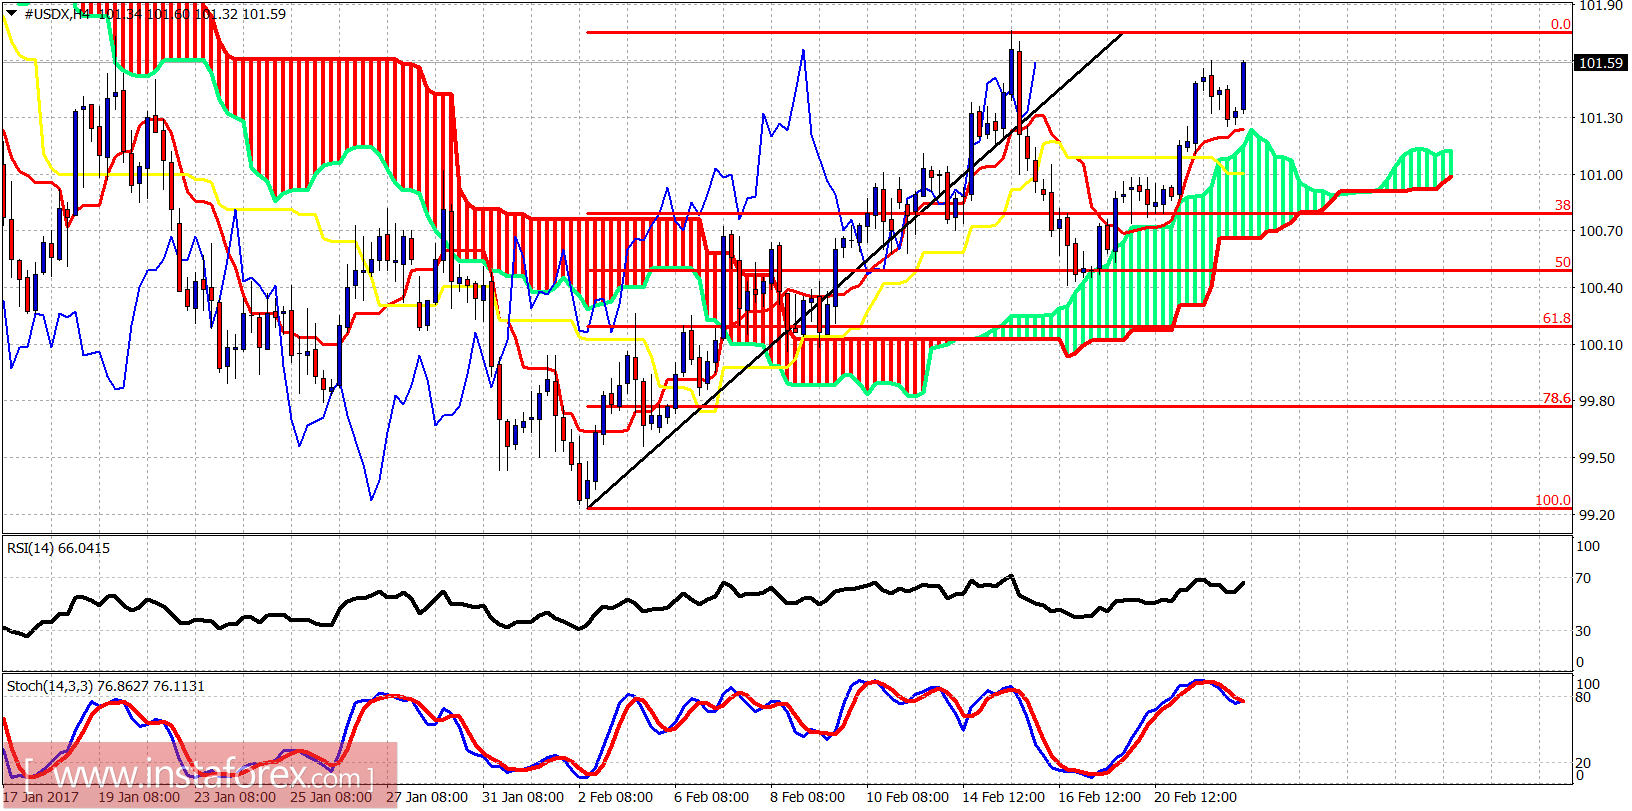
The Dollar index is trading above the Ichimoku cloud. Short-term important resistance is very close to 101.80. Short-term support is at 101. Trend is bullish in all time frames. Important support that would change short-term trend is at the recent low at 100.40.
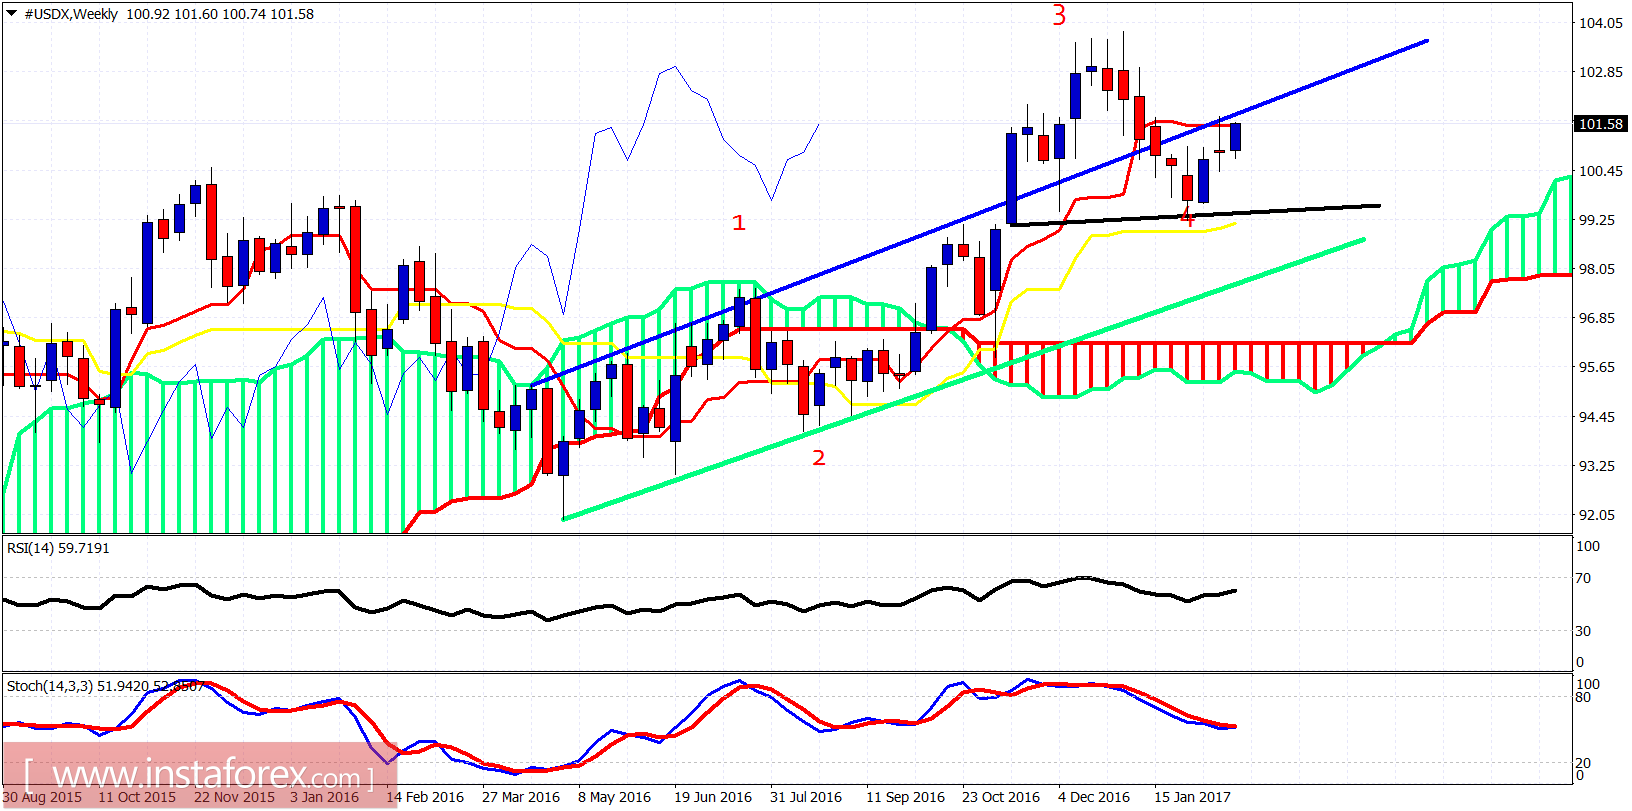 Black line - neckline resistance
 Green line - long-term trendline support
Blue line - resistance
The Dollar index is testing resistance at 101.80-102. Breaking above it will open the way for a push towards 103 at least before a bigger pullback. Long-term critical support now remains at 99.25 where the neckline of the potential Head and Shoulder pattern is found. So, the bulls remain in control.