English
  Русский
 Bahasa Indonesia
 Bahasa Malay
 ไทย
ไทย Español
 Deutsch
 Български
 Français
 Tiếng Việt
 中文
中文 বাংলা
বাংলা हिन्दी
 Čeština
 Українська
 Română

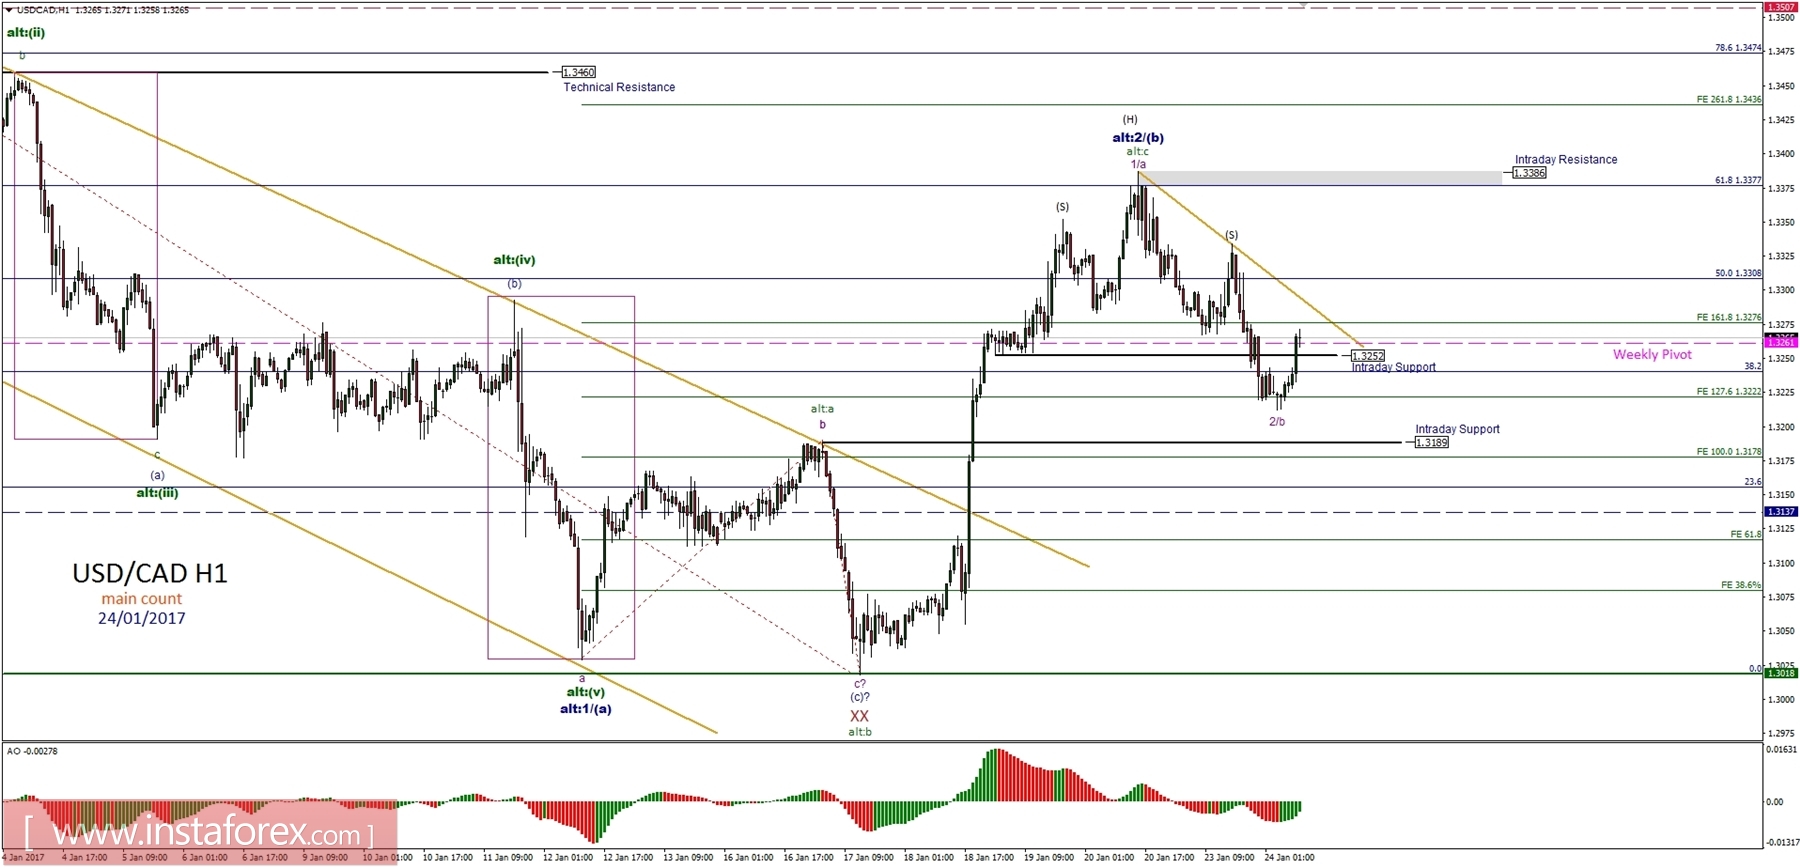
General overview for 24/01/2017:
The bottom for the wave 2/b (green) might be in place at the level of 1.3212. The price moved higher above the intraday support at the level of 1.3252 and now is threating to violate the intraday golden trend line. Any breakout above it will be another clue, that the bottom for wave 2/b is in place, nevertheless, the bulls must still break out above the wave 1/a (green) high at the level of 1.3386 to confirm the bottom.
Support/Resistance:
1.3018 - Technical Support
1.3137 - WS1
1.3189 - Technical Support
1.3252 - Intraday Support
1.3261 - Weekly Pivot
1.3386 - Intraday Resistance
1.3507 - WR1
Trading recommendations:
The head and shoulder pattern might be completed. If the golden trend line is clearly violated, then only buy orders should be opened with SL below the level of 1.3212 and TP at the level of 1.3386.