English
  Русский
 Bahasa Indonesia
 Bahasa Malay
 ไทย
ไทย Español
 Deutsch
 Български
 Français
 Tiếng Việt
 中文
中文 বাংলা
বাংলা हिन्दी
 Čeština
 Українська
 Română

The Dollar index has started providing bullish divergence signs in the 4-hour RSI. This is the first non-confirmed low in the Dollar index. Yesterday I supported the view that the new low was expected to be weak and soon we should see a strong upward bounce.
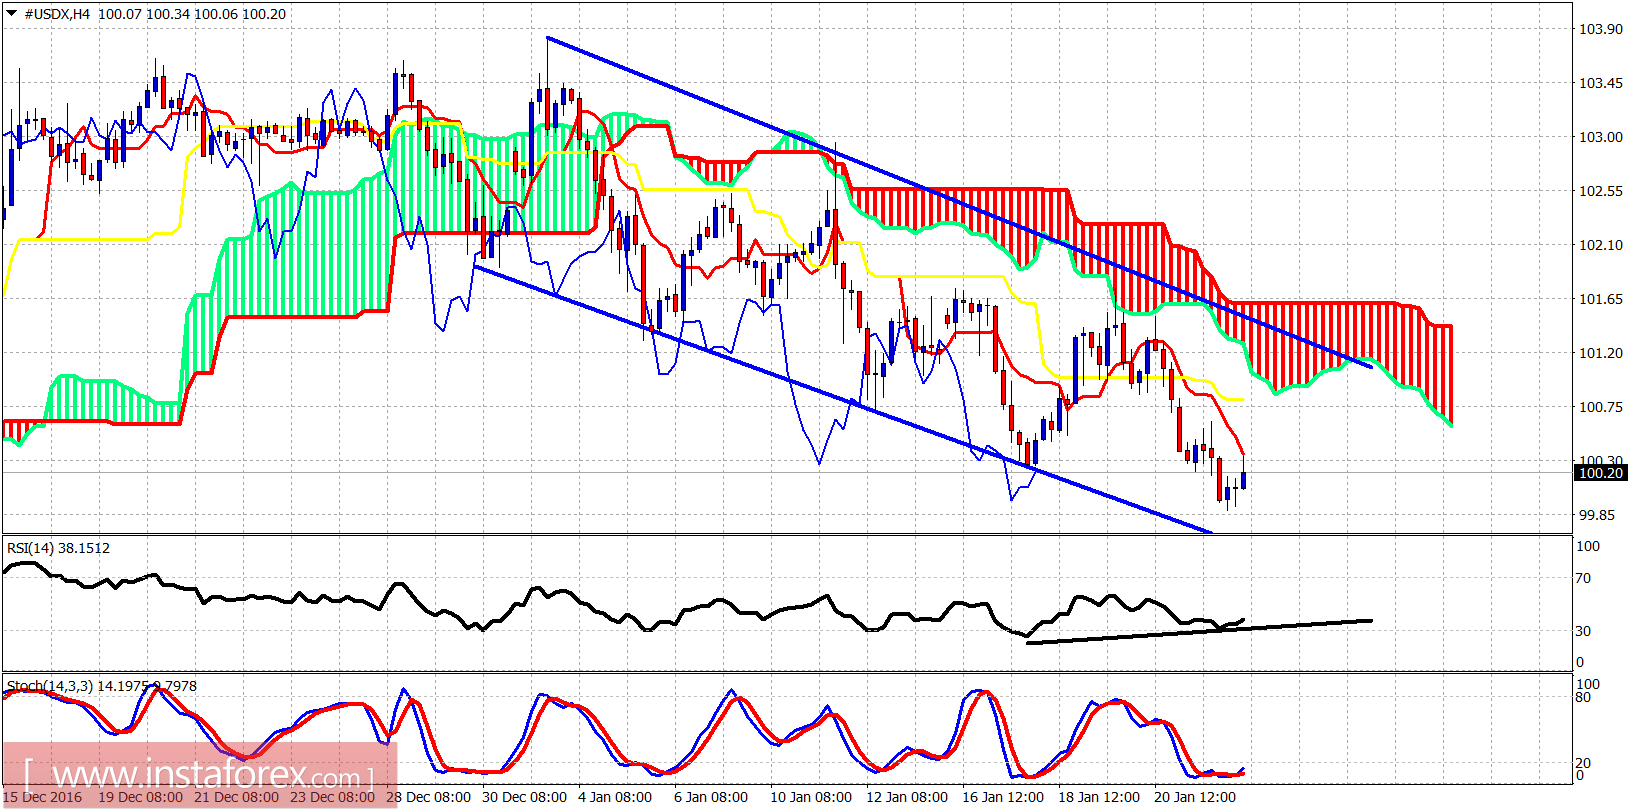
The early bounce towards 100.60 was weak and price reversed and provided a new lower low at 99.87 which was closer to our target. The new low was not confirmed by the RSI. The Dollar index remains inside the bearish channel and below the Ichimoku cloud. Trend remains bearish. Resistance is at 101. We could see a test of that area today.