English
  Русский
 Bahasa Indonesia
 Bahasa Malay
 ไทย
ไทย Español
 Deutsch
 Български
 Français
 Tiếng Việt
 中文
中文 বাংলা
বাংলা हिन्दी
 Čeština
 Українська
 Română

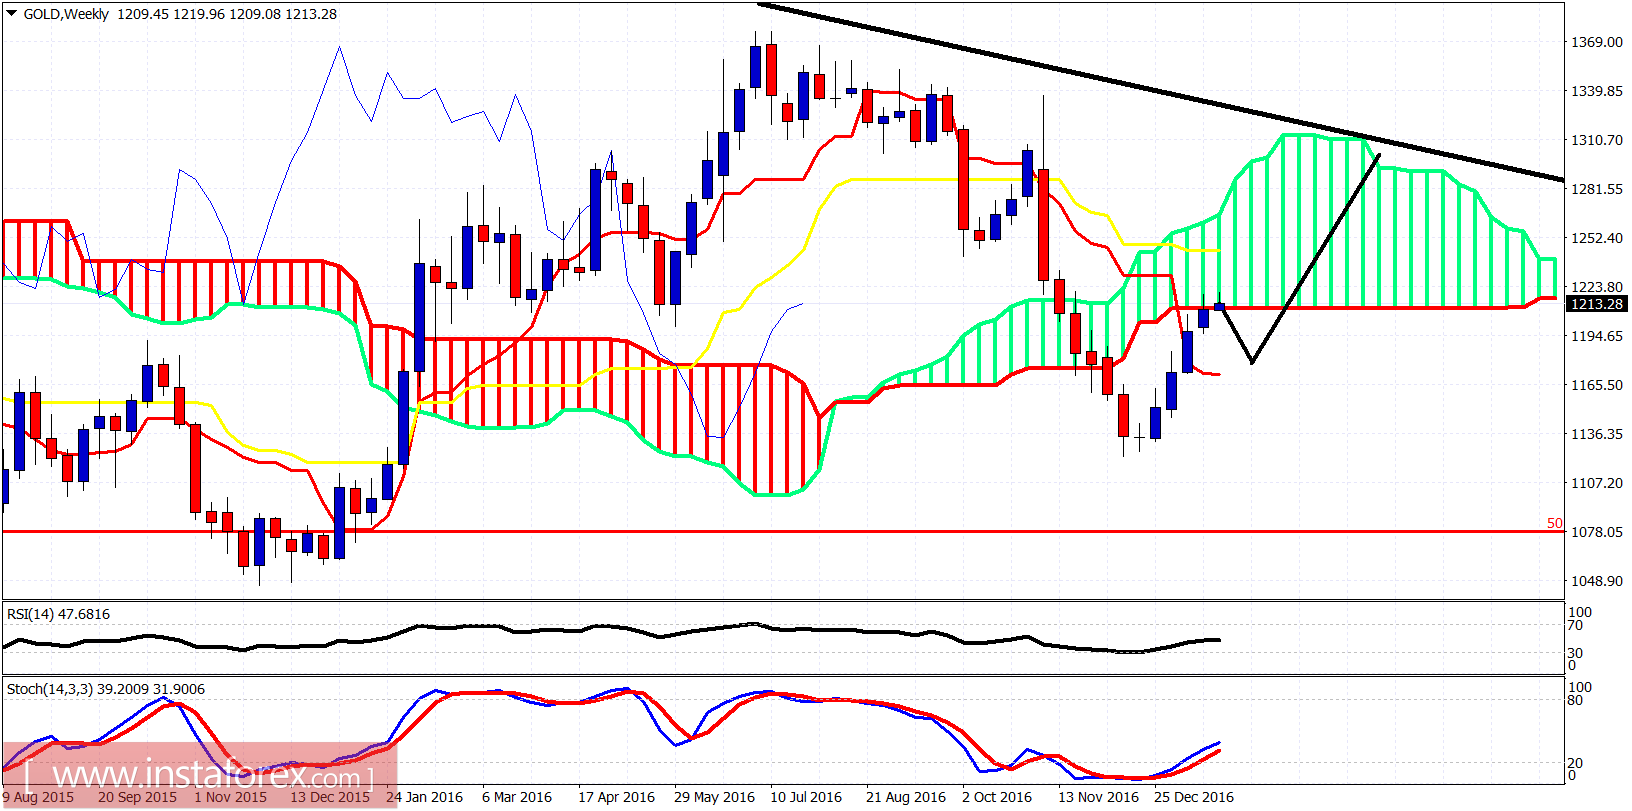
Gold price has made a double top at $1,220. Despite the continued Dollar weakness Gold has not managed to break to new highs. There are several bearish short-term indications and I continue to expect a pullback towards $1,160-$1,180.
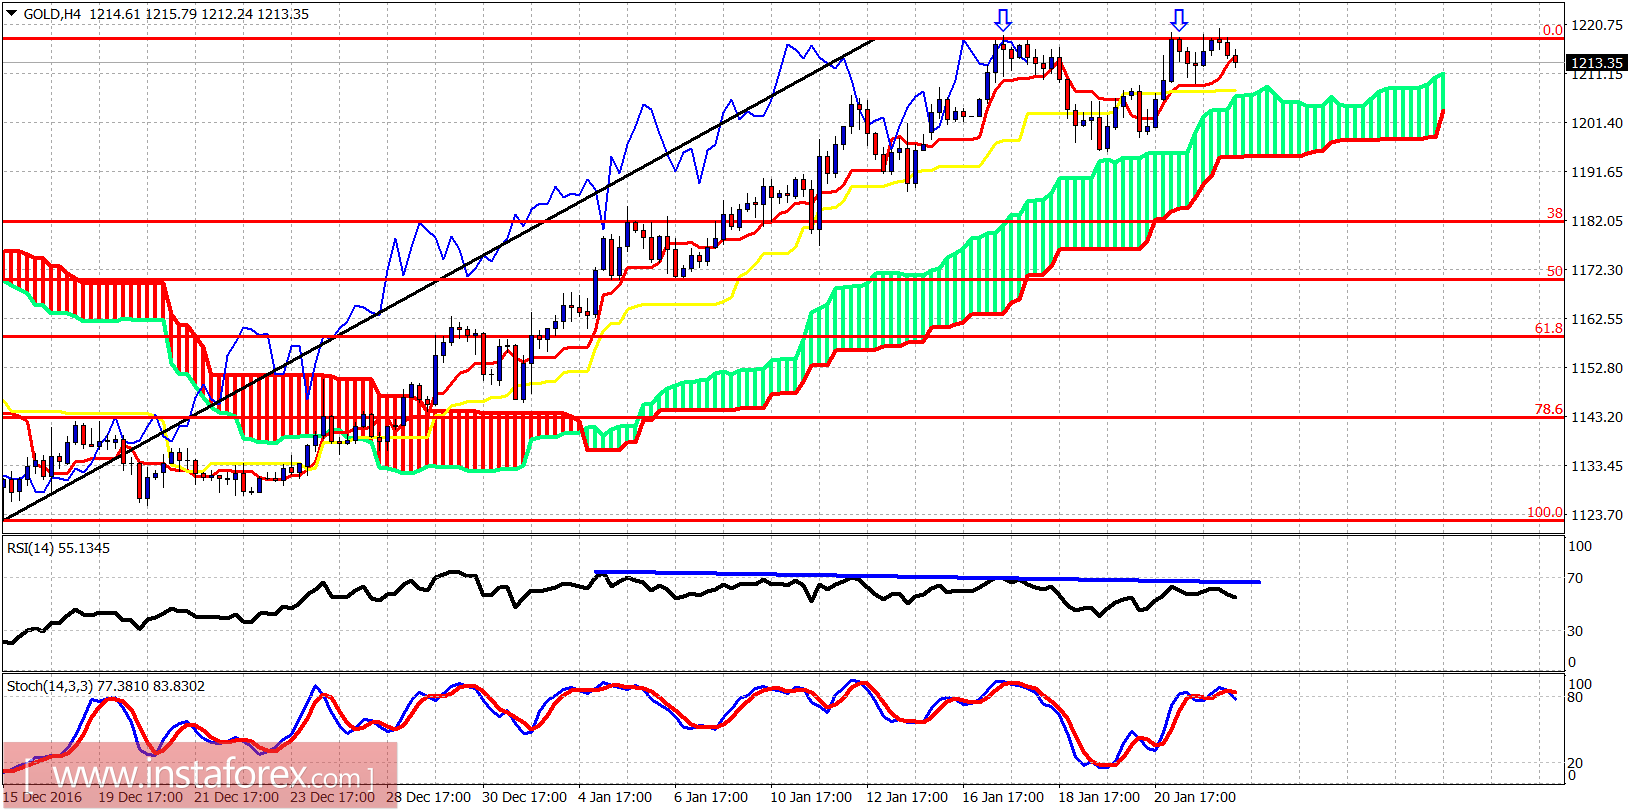
Arrows - double top
Short-term resistance is at $1,220. If broken, we should push towards $1,235. Support is at $1,210 and at $1,197. If broken, we go towards $1,180 first and then towards $1,160. Short-term trend remains bullish as long as price is above the Ichimoku cloud. But the RSI is diverging for some time now and the stochastic turning lower from overbought levels provide a warning for bulls.