 English
  Русский
 Bahasa Indonesia
 Bahasa Malay
 ไทย
ไทย Español
 Deutsch
 Български
 Français
 Tiếng Việt
 中文
中文 বাংলা
বাংলা हिन्दी
 Čeština
 Українська
 Română

The index once again is looking to trade lower as it's challenging the support level of 100.00. If we see a breakout lower around that area, we can expect another decline towards 98.98. The dynamic resistance offered by the 200 SMA at H1 chart remains intact and as long as USDX continues to trade below that moving average, a consolidation below the 100.00 handle for the short-term is likely to happen.
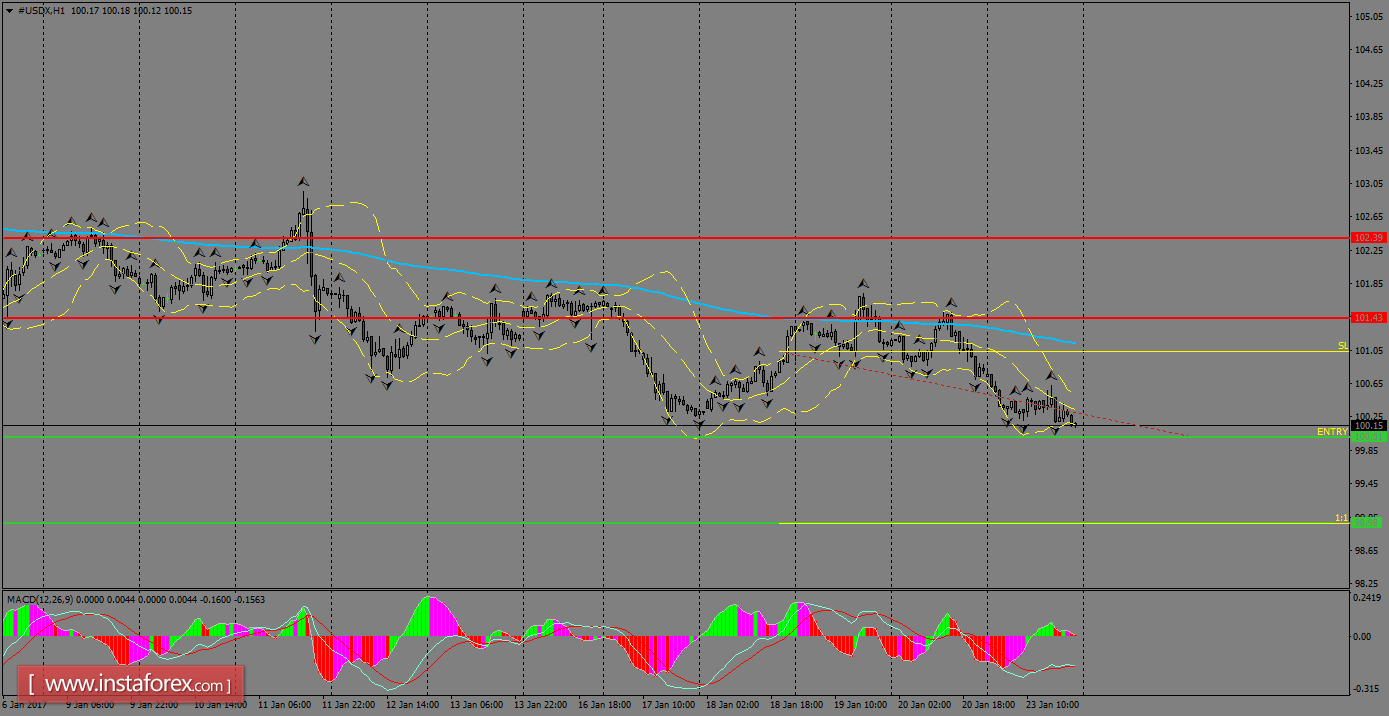
H1 chart's resistance levels: 101.43 / 102.39
H1 chart's support levels: 100.01 / 98.98
Trading recommendations for today: Based on the H1 chart, place sell (short) orders only if the USD Index breaks with a bearish candlestick; the support level is at 100.01, take profit is at 98.98 and stop loss is at 101.03.