 English
  Русский
 Bahasa Indonesia
 Bahasa Malay
 ไทย
ไทย Español
 Deutsch
 Български
 Français
 Tiếng Việt
 中文
中文 বাংলা
বাংলা हिन्दी
 Čeština
 Українська
 Română

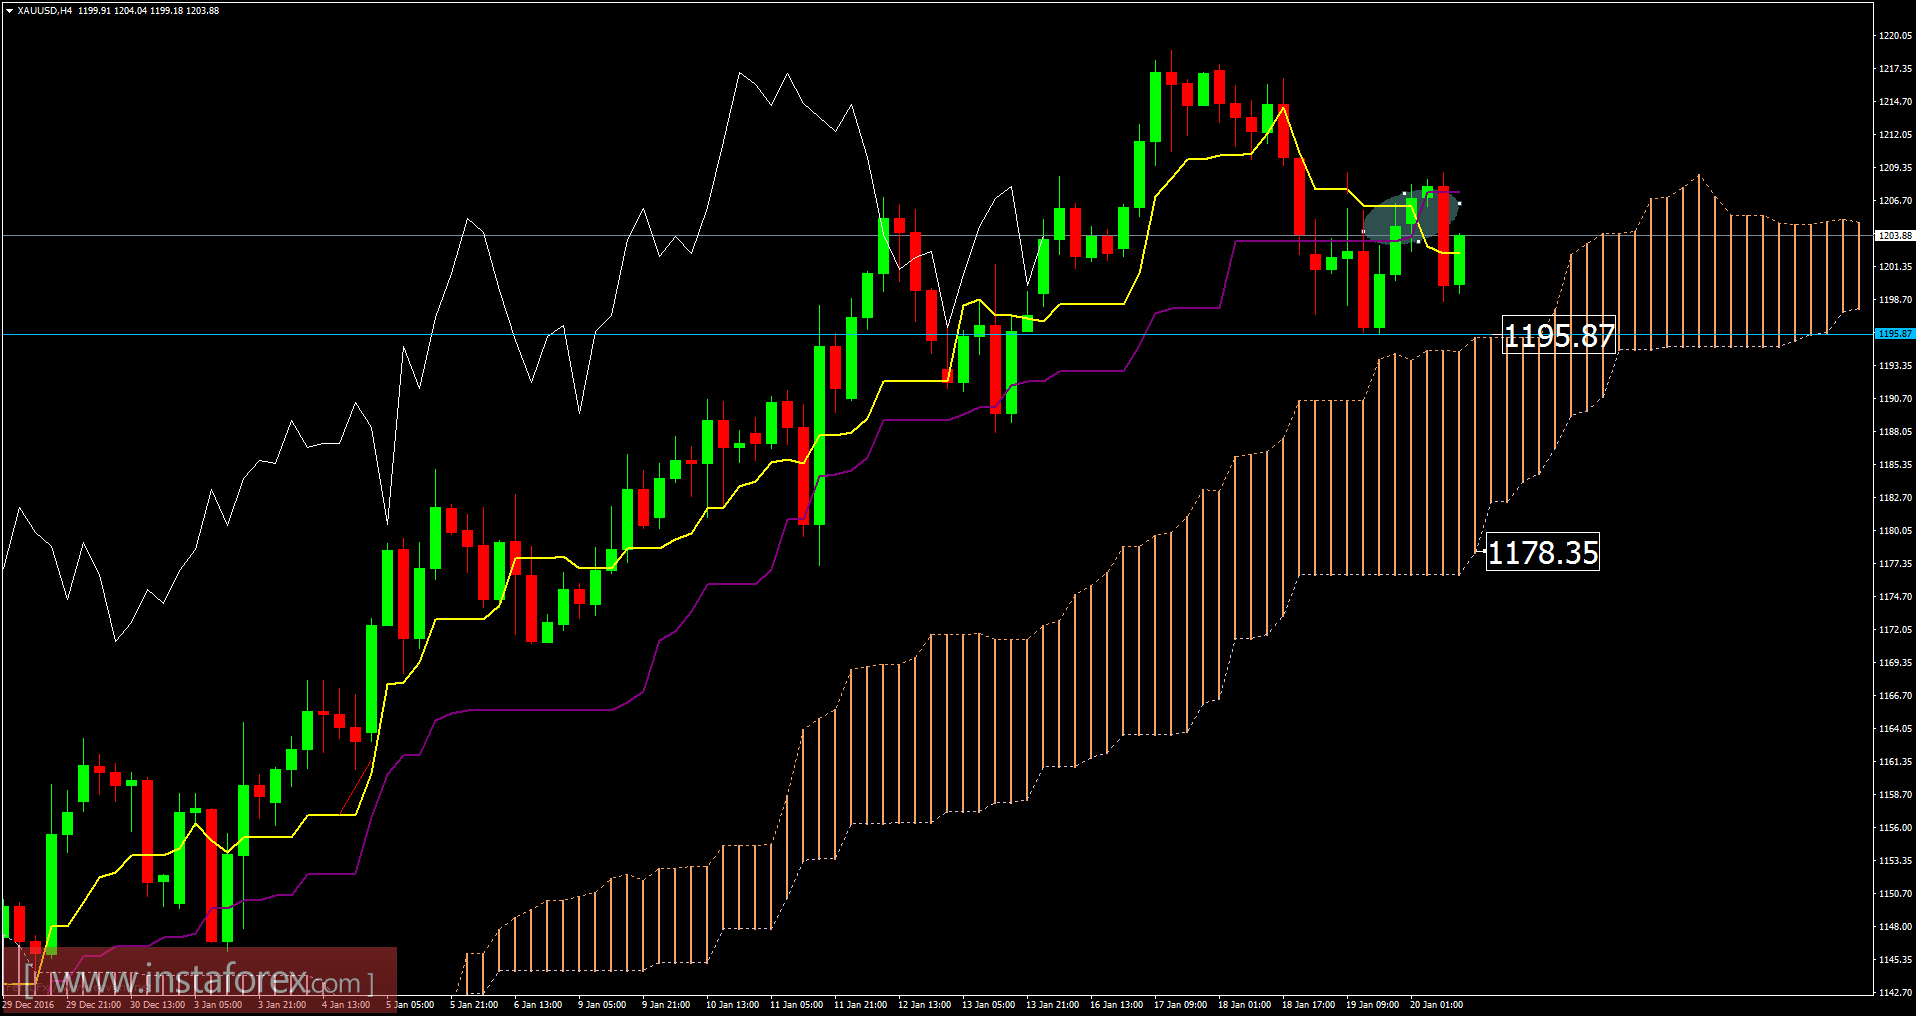
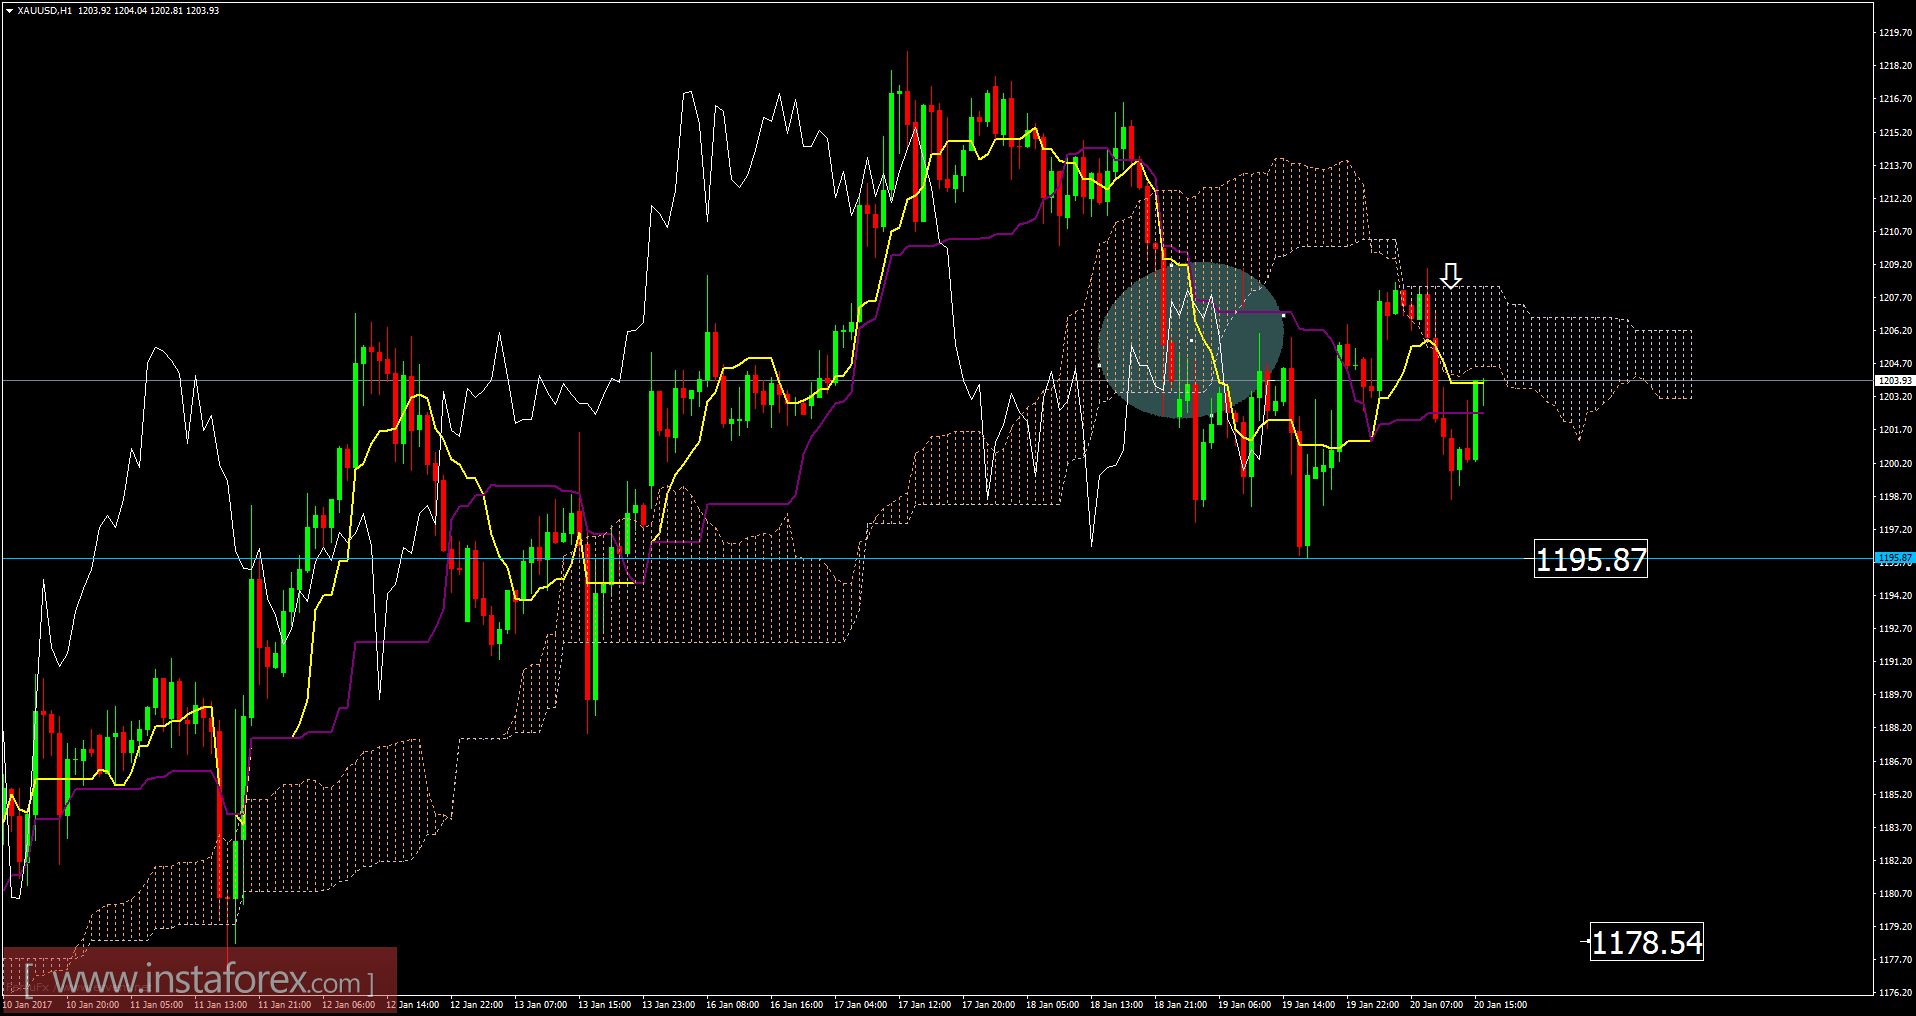
Recently, gold has been trading sideways at the price of $1,203.00. In the 4H time frame and using the Ichimoku cloud, I found that there is potential space for a downward correction. I found cross Tenkan sen-Kijun sen which is a sign for potential weakness and it is weak sell signal on 4H time frame. Anyway, according to the 1H time frame, I found that price has broken the Ichimoku cloud for downside, which is also a sign of weakness. Pay attention on downward levels at $1,195.85 and $1,178.55. Watch for potential selling opportunities.
Resistance levels:
R1: 1,203.35
R2: 1,205.30
R3: 1,208.45
Support levels:
S1: 1,197.10
S2: 1,195.15
S3: 1,192.05
Trading recommendations for today: Watch for selling opportunities.