 English
  Русский
 Bahasa Indonesia
 Bahasa Malay
 ไทย
ไทย Español
 Deutsch
 Български
 Français
 Tiếng Việt
 中文
中文 বাংলা
বাংলা हिन्दी
 Čeština
 Українська
 Română

The dollar index is still inside the bearish channel on a short-term basis. Price is heading towards 100 where the medium-term support is found. If the index breaks above 102.65, the trend can change to bullish targeting 105-106.
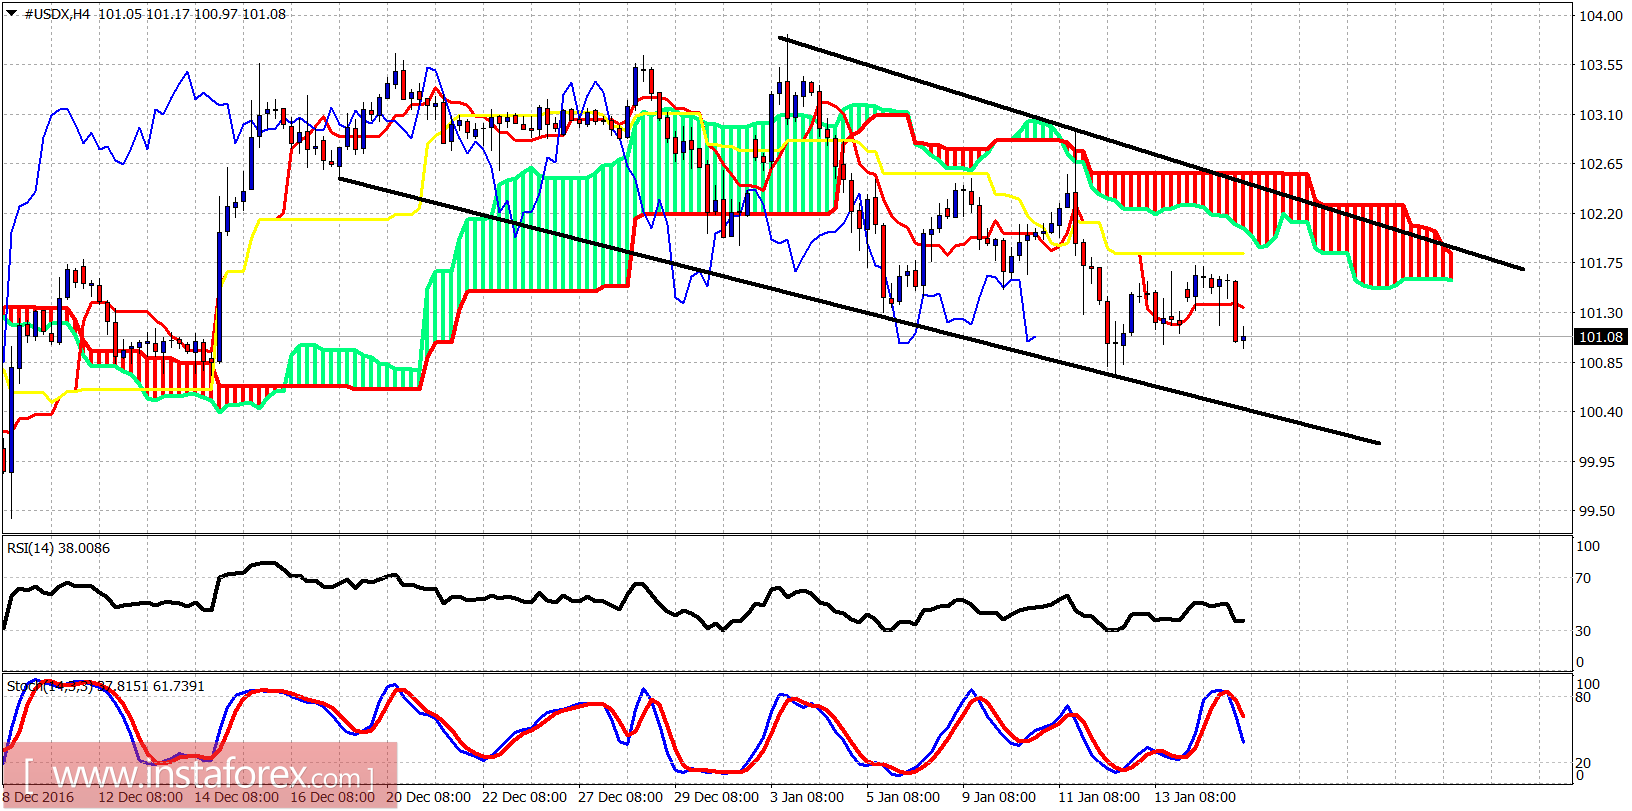
Price is making lower lows and lower highs. The fact that it is trading below the Ichimoku cloud confirms the bearish trend. Short-term support is at 100.50 while resistance lies at 102. Bulls need to break above 102.65 in order to confirm a bullish trend reversal. However there are still no signs of a bullish divergence on the 4 hour chart, so the dollar index may continue to be pressured.
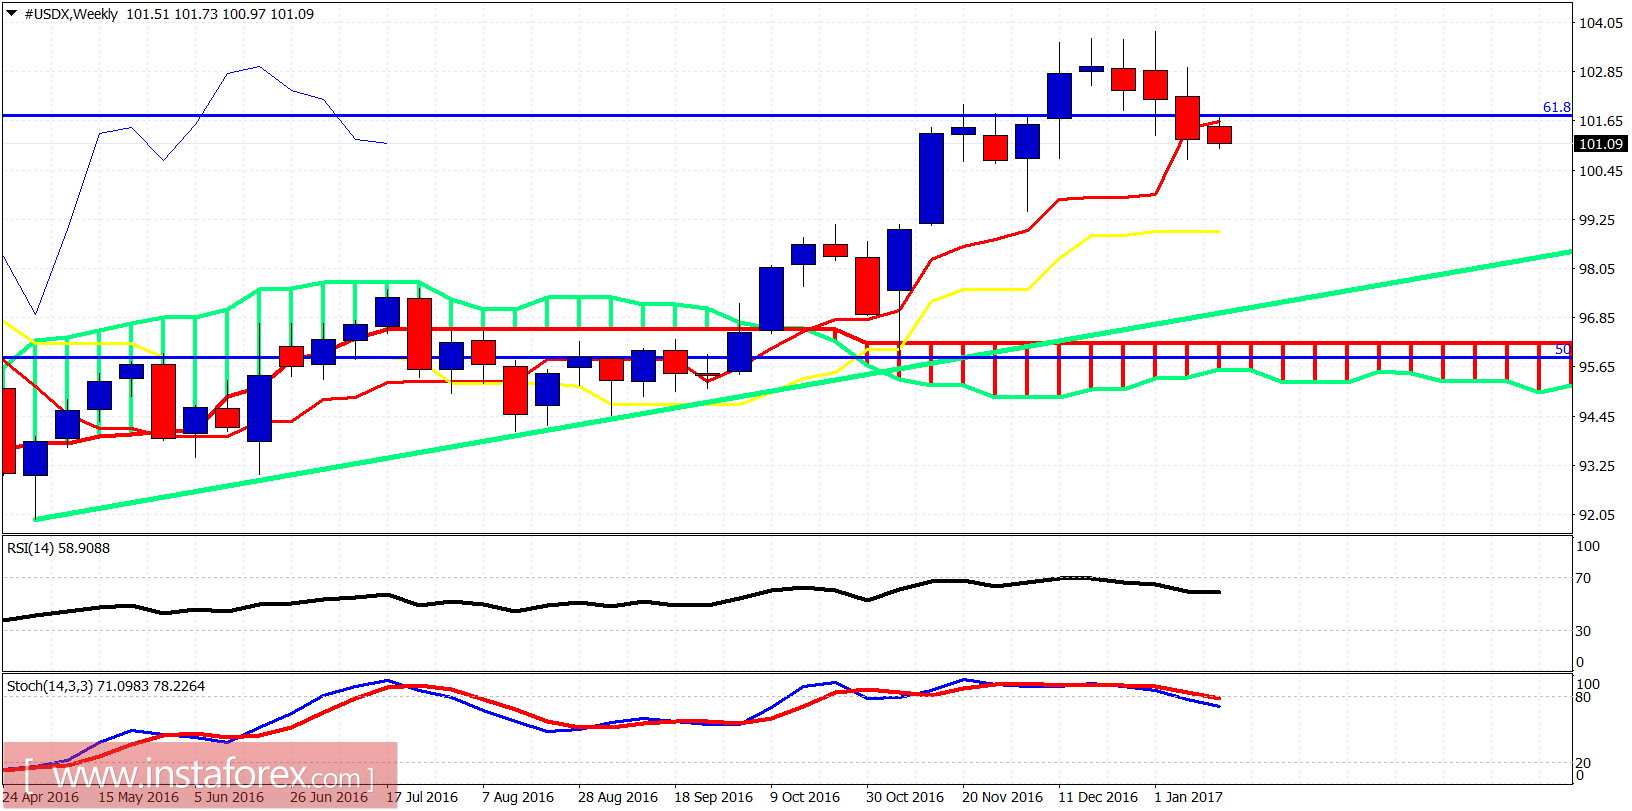
On a weekly basis, we can see the index closed last week below the Tenkan-Sen (red line indicator). A lower low this week will open the way for a move lower towards the Kijun-sen (yellow line indicator) at 99 where critical long-term support is found. The oscillators are turning lower from overbought levels and this is a bearish long-term sign. The long-term green trend line remains the most important support of the longer-term trend.