 English
  Русский
 Bahasa Indonesia
 Bahasa Malay
 ไทย
ไทย Español
 Deutsch
 Български
 Français
 Tiếng Việt
 中文
中文 বাংলা
বাংলা हिन्दी
 Čeština
 Українська
 Română

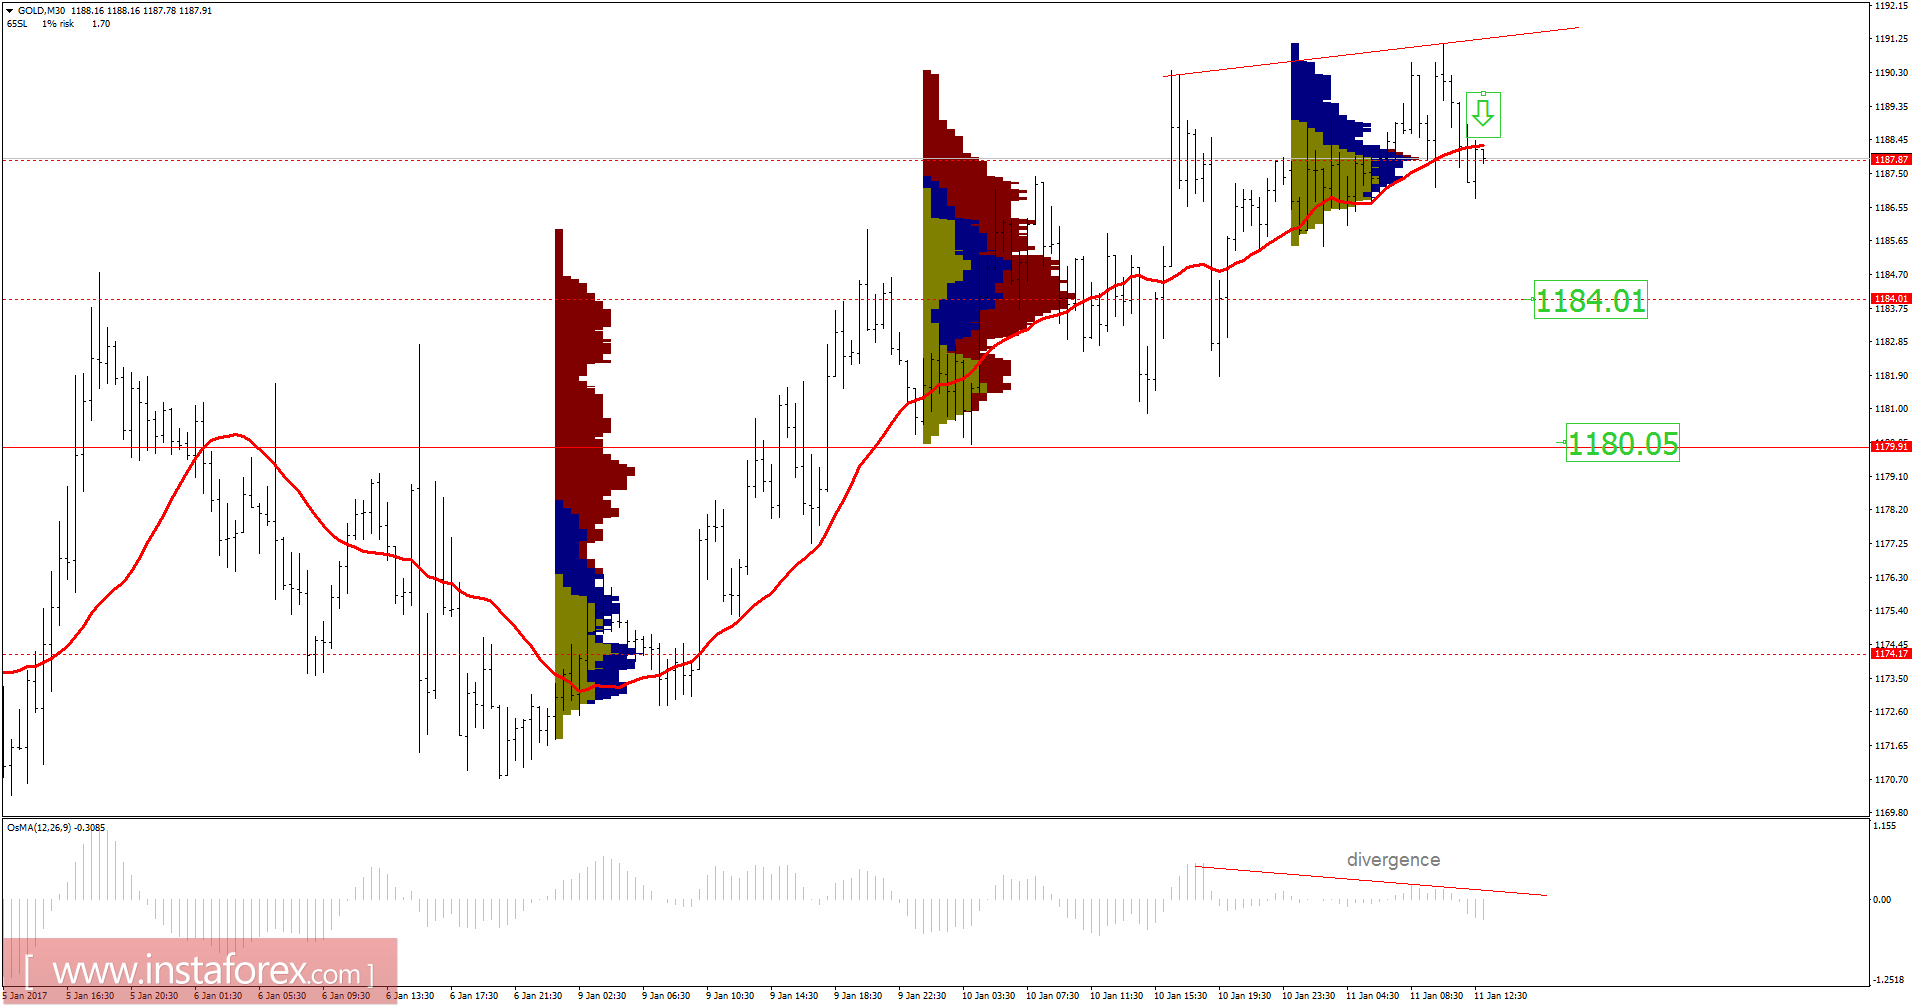
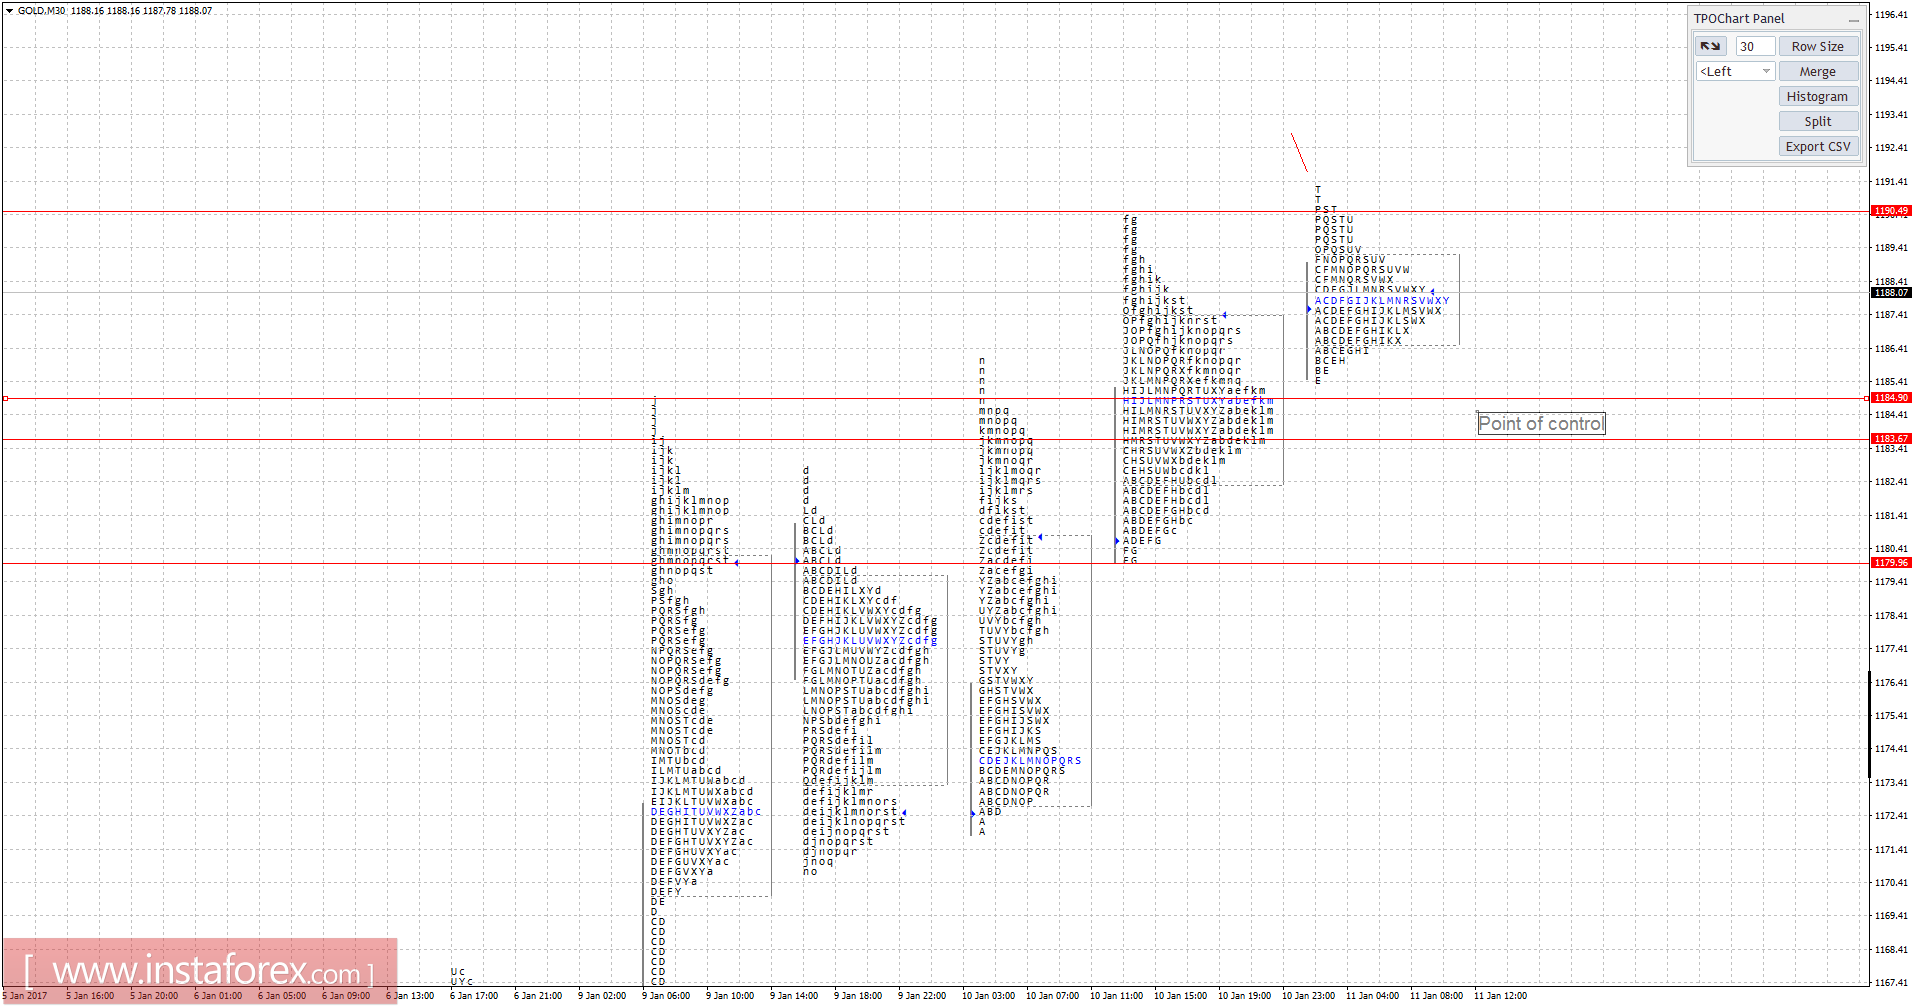
Recently, gold has been trading upwards. The price tested the level of $1,191.10 in an average volume. According to the 30M time frame, I found a fake breakout of yesterday's high, which is a sign of weakness. There is also a divergence in the Moving Average Oscilator. The price made a higher high and the oscilator made a lower high. My advice is to watch for potential selling opportunities. The downward target is set at the price of $1,184.50. Using the TPO Chart, I found yesterday's point of control at the price of $1,184.00. Anyway, if the price breaks the level of $1,191.10 in a high volume, we may see potential testing of $1,195.00
Resistance levels:
R1: 1,187.65
R2: 1,189.00
R3: 1,191.75
Support levels:
S1: 1,182.60
S2: 1,181.00
S3: 1,178.50
Trading recommendations for today: Watch for potential selling opportunities.