 English
  Русский
 Bahasa Indonesia
 Bahasa Malay
 ไทย
ไทย Español
 Deutsch
 Български
 Français
 Tiếng Việt
 中文
中文 বাংলা
বাংলা हिन्दी
 Čeština
 Українська
 Română

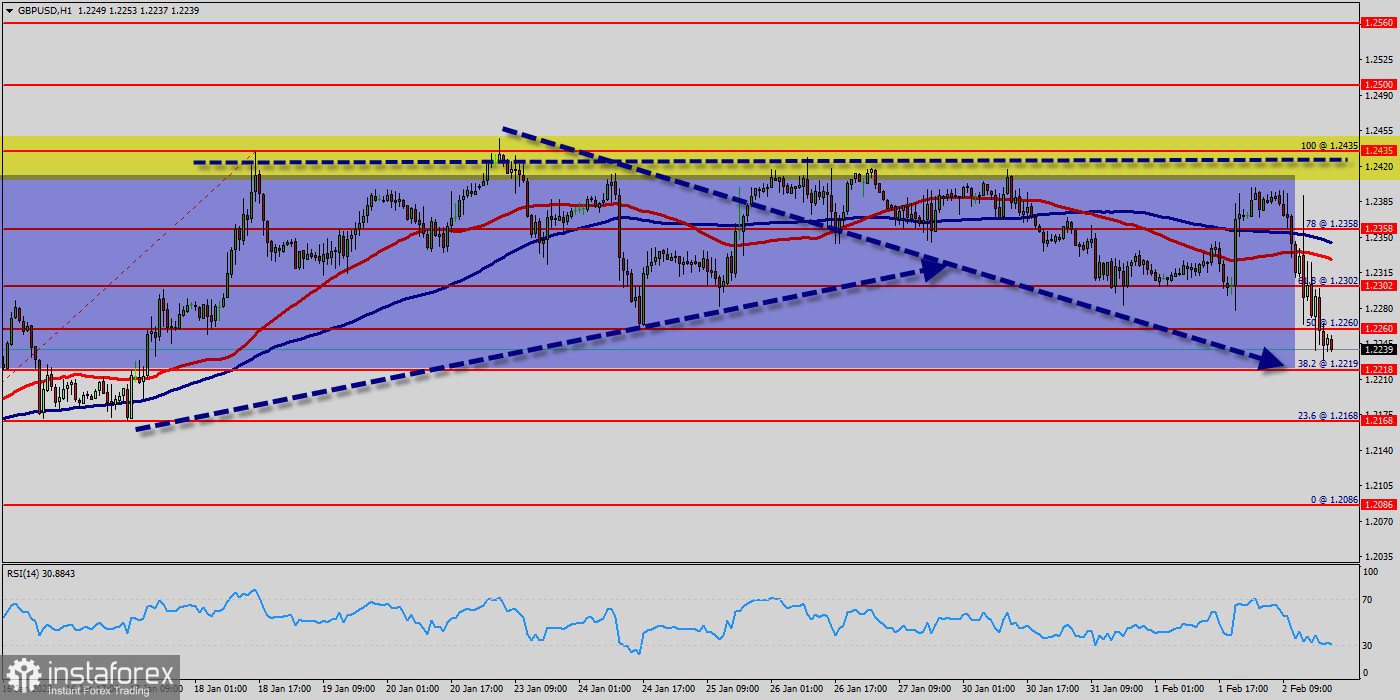
Overview:
The bullish trend is currently very strong on the EUR/USD pair. As long as the price remains above the support levels of 1.2218, you could try to benefit from the growth.The first bullish objective is located at the price of 1.2219. The bullish momentum would be boosted by a break in this resistance (1.2302). The hourly chart is currently still bullish. At the same time, some stabilization tendencies are visible between 1.2218 and 1.2302. Together with the relatively large distance to the fast-rising 100-day moving average (1.2302), there are some arguments for a relief rally in coming months on the table.
The Relative Strength Index (RSI) is considered overbought because it is above 35. The RSI is still signaling that the trend is upward as it is still strong above the moving average (100). This suggests the pair will probably go up in coming hours. This support has been rejected for three times confirming uptrend veracity. Hence, major support is seen at the level of 1.2302 because the trend is still showing strength above it. The Relative Strength Index (RSI) is considered oversold because it is above 30. At the same time, the RSI is still signaling an upward trend, as the trend is still showing strong above the moving average (100), this suggests the pair will probably go up in coming hours. Accordingly, the market is likely to show signs of a bullish trend. In other words, buy orders are recommended above 1.2302 with the first target at the level of 1.2358. From this point, the pair is likely to begin an ascending movement to the point of 1.2358 and further to the level of 1.2435. The level of 1.2435 will act as strong resistance and the double top is already set at the point of 1.2435. On the other hand, if a breakout happens at the support level of 1.2302, then this scenario may become invalidated.
Conclusion:
We should see the pair climbing towards the next target of 1.2435. The pair will move upwards continuing the development of the bullish trend to the level 1.2435 and 1.2500 in coming days. On the other hand, in case a reversal takes place and the GBP/USD pair breaks through the support level of 1.2302, a further decline to 1.2218 can occur. It would indicate a bearish market.