 English
  Русский
 Bahasa Indonesia
 Bahasa Malay
 ไทย
ไทย Español
 Deutsch
 Български
 Français
 Tiếng Việt
 中文
中文 বাংলা
বাংলা हिन्दी
 Čeština
 Українська
 Română

To open long positions on GBP/USD, you need:
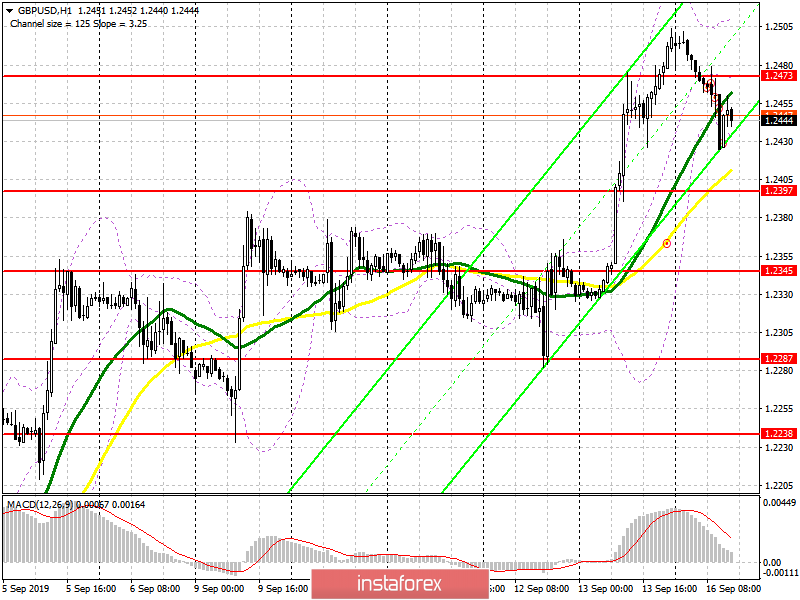
Buyers of the pound retreated from the market, but the demand remains high enough, and it is clear that with each downward correction, traders open new long positions. At the moment, the task of the bulls is to break through the resistance of 1.2473, which was formed in the first half of the day, which will only confirm plans for a further bullish trend. In this scenario, the bulls will strive for new highs in the area of 1.2534 and 1.2563, where I recommend fixing the profit. If GBP/USD will continue to gradually decline, I recommend to return to purchases only after updating the minimum of 1.2397 and a rebound from the larger range of 1.2345.
To open short positions on GBP/USD, you need:
Bears continue to gradually push the pound down after a major rise on Friday, which was based on rumors of a new Brexit agreement, which the UK government should provide today for review by EU leaders. While there is no news, the pound is gradually sliding down. The current target of the sellers is the support of 1.2397, the breakthrough of which will only increase the pressure on the pair and lead to the test of the minimum of 1.2345, where I recommend fixing the profit. If the bulls return to the market on positive news on Brexit, which will lead to a breakout of the resistance at 1.2473, it is best to consider new short positions after updating the highs at 1.2534 and 1.2563.
Signals:
Moving Averages
Trading around 30 and 50 moving averages, indicating some market uncertainty.
Bollinger Bands
In the scenario of the pound growth in the second half of the day, the upper limit of the indicator around 1.2510 will act as resistance.
Description of indicators
- MA (moving average) 50 days – yellow
- MA (moving average) 30 days – green
- MACD: fast EMA 12, slow EMA 26, SMA 9
- Bollinger Bands 20