 English
  Русский
 Bahasa Indonesia
 Bahasa Malay
 ไทย
ไทย Español
 Deutsch
 Български
 Français
 Tiếng Việt
 中文
中文 বাংলা
বাংলা हिन्दी
 Čeština
 Українська
 Română

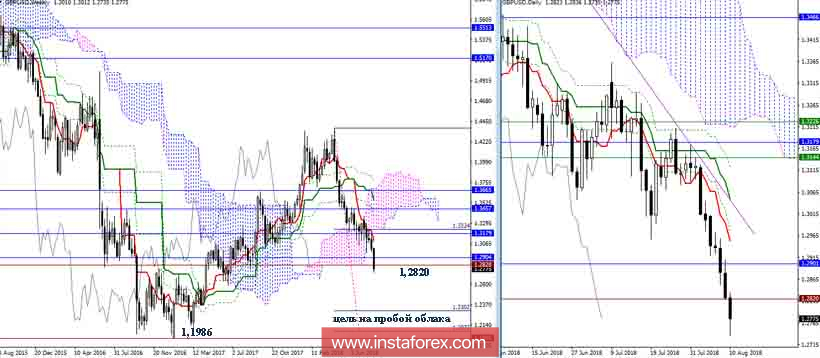
GBP / USD
Bears are close to the breakdown of the next support zone. What's next? Overcoming the current support and secure securing below reveals fairly long horizons before the players to descend, a downward target for the breakdown of the weekly cloud (1.2302 - 1.2027) and an update of the January-March minimum (1.1986). There is something to try for now.
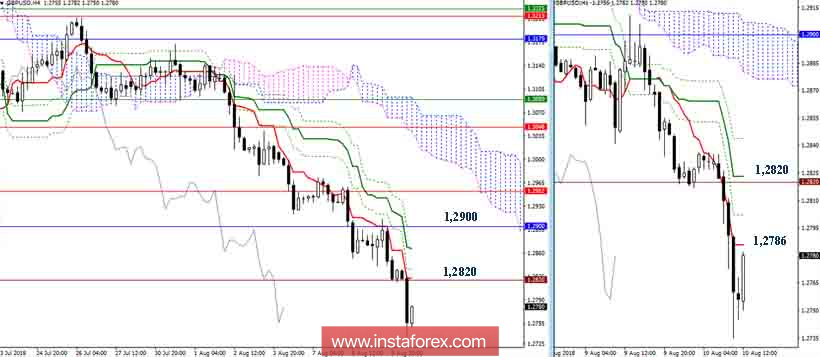
The advantages are now on the side of the players to downgrade. Nevertheless, at the moment, there is a braking and corrective lift. The nearest resistance is 1.2786 (Tenkan N4), further 1.2820 (Tenkan N4 + Kijun N1 + historical level) and 1,2900 (Fibo Kijun N4 + cloud N1 + monthly Fibo Kijun). Today, we close the week, because, how deep the upsurge will be, the preferences and prospects of the next week depend.
Indicator parameters:
All time intervals 9 - 26 - 52
The color of indicator lines:
Tenkan (short-term trend) - red,
Kijun (medium-term trend) - green,
Fibo Kijun is a green dotted line,
Chinkou is gray,
Clouds: Senkou Span B (SSB, long-term trend) - blue,
Senkou Span A (SSA) - pink.
The color of additional lines:
Support and resistance MN - blue, W1 - green, D1 - red, H4 - pink, H1 - gray,
Horizontal levels (not Ichimoku) - brown,
Trend lines - purple.