 English
  Русский
 Bahasa Indonesia
 Bahasa Malay
 ไทย
ไทย Español
 Deutsch
 Български
 Français
 Tiếng Việt
 中文
中文 বাংলা
বাংলা हिन्दी
 Čeština
 Українська
 Română

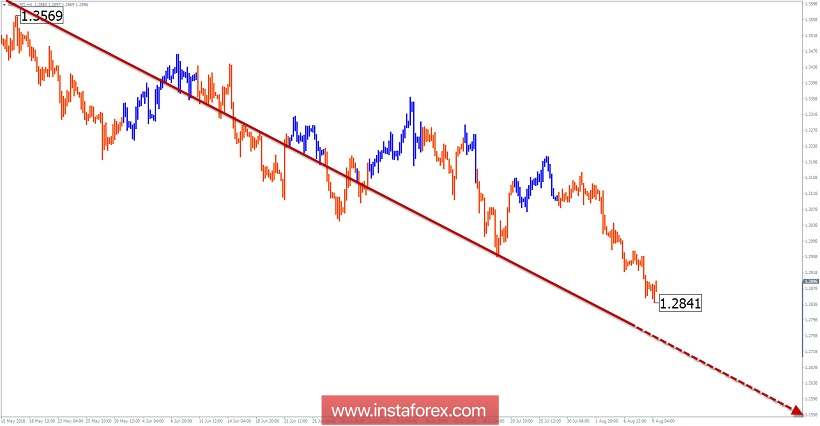
The wave pattern of the H4 graph:
The descending wave of January 25 is not complete. Its wave level has already exceeded the scale of the chart under consideration of the pair.
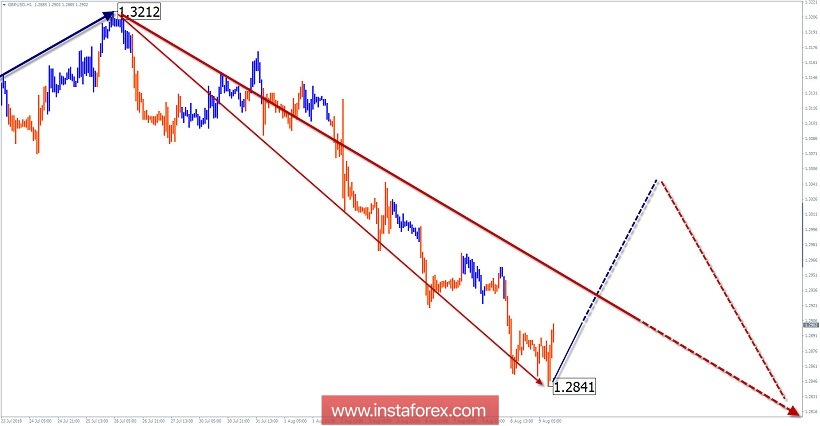
The wave pattern of the H1 graph:
In a higher wave model, the descending wave of April 17 forms the final part (C).
The wave pattern of the M15 chart:
The direction of movement in the last few weeks is set by the downward wave of July 26. In the structure, there is a need for an upward rollback for correction.
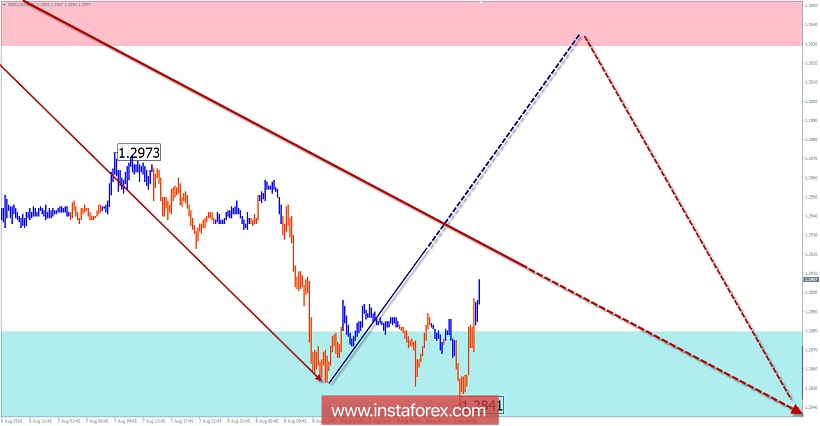
Recommended trading strategy:
Purchases are risky and only possible at the lowest timeframe. For sales on higher timeframes, it is recommended to sell the pair. You must wait until the rollback is completed.
Resistance zones:
- 1.3030 / 1.3080
Support zones:
- 1.2880 / 1.2830
Explanations to the figures:
A simplified wave analysis uses a simple waveform, in the form of a 3-part zigzag (ABC). The last incomplete wave for every timeframe is analyzed. Zones show the calculated areas with the greatest probability of a turn.
Arrows indicate the counting of wave according to the technique used by the author. The solid background shows the generated structure and the dotted exhibits the expected wave motion.
Attention: The wave algorithm does not take into account the duration of the tool movements in time. To conduct a trade transaction, you need to confirm the signals used by your trading systems.