 English
  Русский
 Bahasa Indonesia
 Bahasa Malay
 ไทย
ไทย Español
 Deutsch
 Български
 Français
 Tiếng Việt
 中文
中文 বাংলা
বাংলা हिन्दी
 Čeština
 Українська
 Română

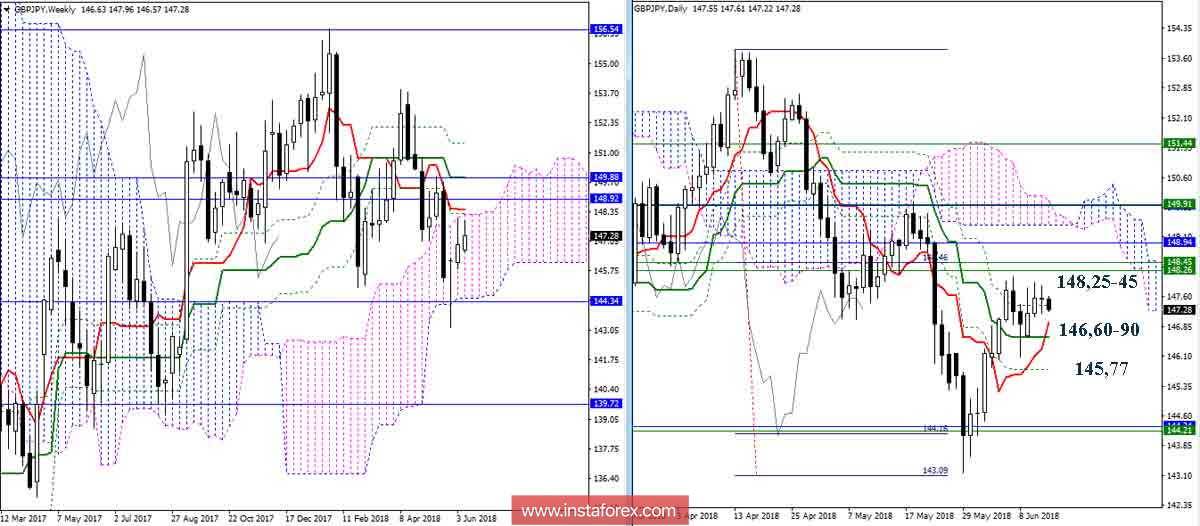
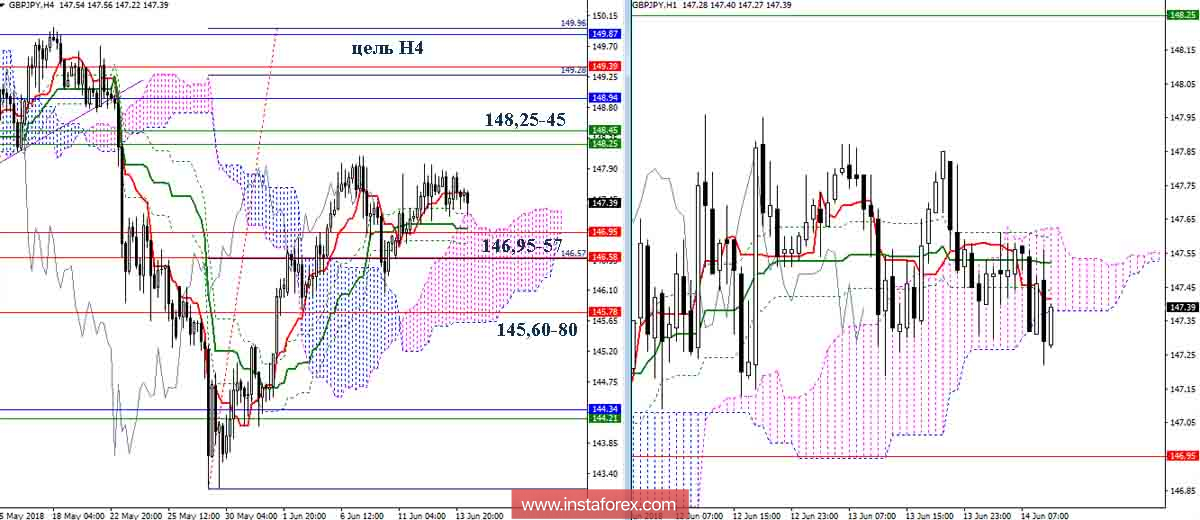
GBP/JPY
Throughout the current week, players on the rise, to continue the climb, tried to go beyond the upper shadow of the last week candle, but they have not been able to achieve a positive result so far. The maximum extremum (148.09) has not been updated, the resistance uniting weekly levels (Senkou Span A 148.25 + Tenkan 148.45 + Fibo Kijun 148.29) has not been tested. These tasks remain a priority. But if there is no progress again today, players on the slide can take advantage of the weakness of the opponent, which will lead to a decrease. The most important support now is the area of 146.95-57 (day cross level + Kijun H4 + upper boundary of the H4 cloud), then you should note the area 145.60-80 (daytime Fibo Kijun + lower boundary of the cloud H4). The consolidation under these supports will change the current balance of power, which is now largely on the side of the bulls, and will require a new assessment of the situation.
Indicator parameters:
all time intervals 9 - 26 - 52
Color of indicator lines:
Tenkan (short-term trend) - red,
Kijun (medium-term trend) - green,
Fibo Kijun is a green dotted line,
Chinkou is gray,
clouds: Senkou Span B (SSB, long-term trend) - blue,
Senkou Span A (SSA) - pink.
Color of additional lines:
support and resistance MN - blue, W1 - green, D1 - red, H4 - pink, H1 - gray,
horizontal levels (not Ichimoku) - brown,
trend lines - purple.