 English
  Русский
 Bahasa Indonesia
 Bahasa Malay
 ไทย
ไทย Español
 Deutsch
 Български
 Français
 Tiếng Việt
 中文
中文 বাংলা
বাংলা हिन्दी
 Čeština
 Українська
 Română

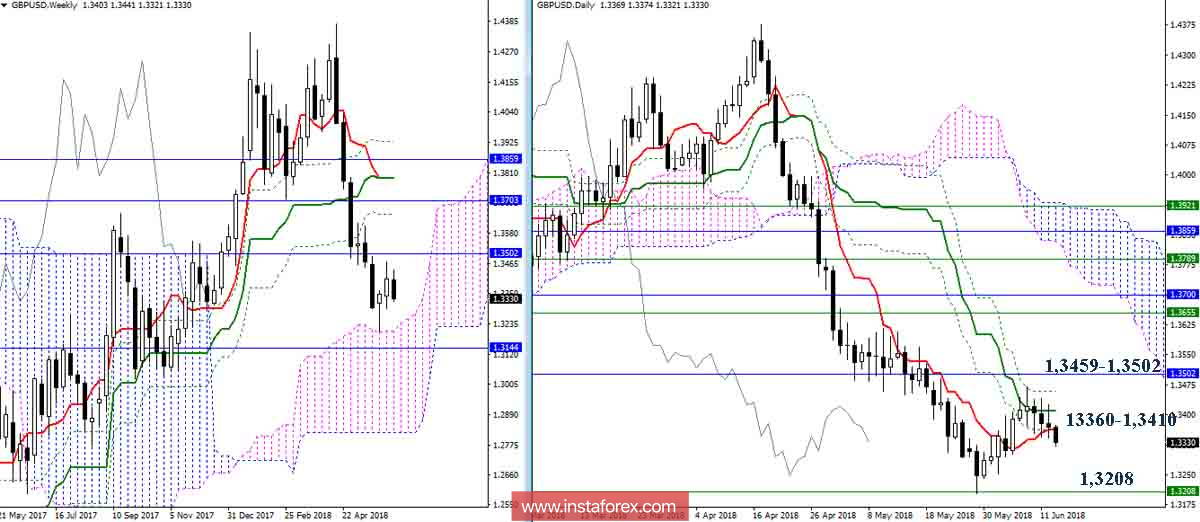
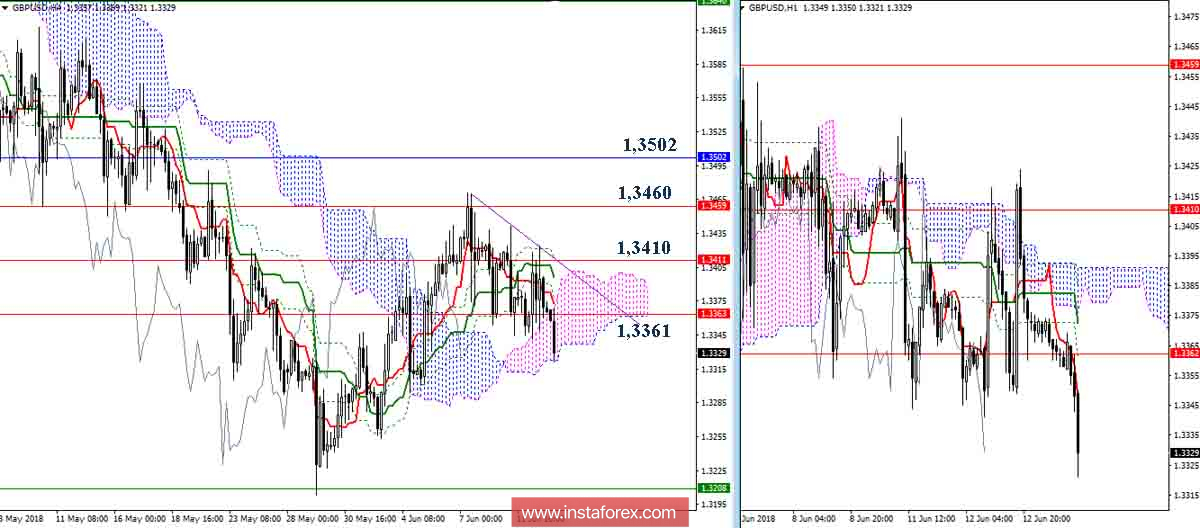
GBP / USD pair
Players on the fall try to complete the upward correction and return to the continuation of the trend, but the force of attraction of the daily cross levels (Kijun 1.3410 + Tenkan 1.3361) does not yet allow the implementation of these plans. Recovery of the downtrend is possible after updating the minimum extremum (1.3203), which is strengthened by the support of the weekly Senkou Span A (1.3208). Staying long in the correction zone will facilitate the change of the day cross and the return of activity of players to rise. The main task in this case will be a breakdown of resistances of 1.3459 - 1.3502 and a continuation of the rise to the levels of the weekly cross and the daytime cloud. At the moment, the initiative and support for the Ichimoku indicator at the lower time intervals belong to the players to fall. The situation can begin to change consistently when it rises and fastens above f 1.3363 – 1.3410 – 1.3459 – 1.3502.
Indicator parameters:
all time intervals 9 - 26 - 52
Color of indicator lines:
Tenkan (short-term trend) - red,
Kijun (medium-term trend) - green,
Fibo Kijun is a green dotted line,
Chikou is gray,
clouds: Senkou Span B (SSB, long-term trend) - blue,
Senkou Span A (SSA) - pink.
Color of additional lines:
support and resistance MN - blue, W1 - green, D1 - red, H4 - pink, H1 - gray,
horizontal levels (not Ichimoku) - brown,
trend lines - purple.