 English
  Русский
 Bahasa Indonesia
 Bahasa Malay
 ไทย
ไทย Español
 Deutsch
 Български
 Français
 Tiếng Việt
 中文
中文 বাংলা
বাংলা हिन्दी
 Čeština
 Українська
 Română

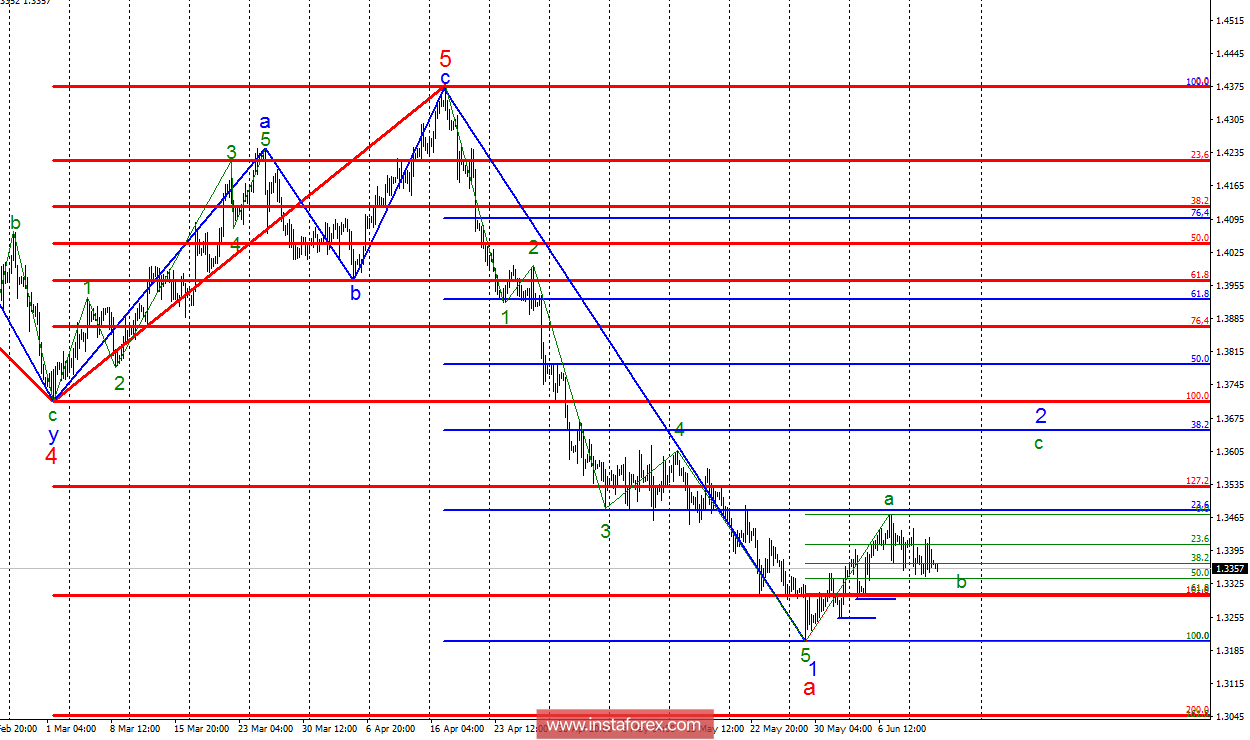
Analysis of wave counting:
During the trades on June 12, the GBP / USD currency pair lost a few more points and almost worked out the calculated mark of 1.3335, which equates to 50.0% of Fibonacci, constructed according to the size of the assumed wave a, 2. Thus, from the mark of 1.3335 or 1.3306 (61.8% Fibonacci), it is expected to resume the increase in quotations within the wave c, 2, with targets near the mark of 1.3651, which corresponds to 38.2% of Fibonacci. Near this mark, it will be possible to expect the resumption of the downward trend segment, which takes its start on April 17.
The objectives for the option with purchases:
1.3478 - 23.6% of Fibonacci
1.3528 - 127.2% of the Fibonacci of the highest order
1.3651 - 38.2% of Fibonacci
The objectives for the option with sales:
1.3045 - 200.0% of the Fibonacci of the highest order
General conclusions and trading recommendations:
The assumed wave 2, a, continues its construction. Now, the pair is at the stage of constructing the internal wave b, 2. About 33 figures, or slightly higher, I recommend starting new purchases of the pair with minimal targets near the mark of 1.3478, which is equivalent to 23.6% of Fibonacci, of the assumed wave c, 2. Stop Loss, I recommend setting below 33 figures in case the corrective set of waves turns out to be very shortened. I recommend returning to the sales of the pair no earlier than a successful attempt to break through the lows of June 1 and 4.